EGLDMultiversX
Egld usdt Daily analysis
Risk rewards ratio >2.2 👈👌
Pattern = two bottoms
First target =21.3$
EGLDUSDT trade ideas

Most Will Get Trapped on EGLD’s Next Move Don’t Be One of ThemYello Paradisers, did you catch the EGLD breakout or are you still waiting for confirmation that’s already gone? While most traders are sleeping on this setup, it has just completed one of the cleanest breakout-and-retest patterns we’ve seen in weeks, and what comes next could leave many trapped on the wrong side.
💎#EGLDUSDT recently broke through its descending resistance with strength and has now retested that same level, which is acting as solid support in the $14.30–$15.00 range. This successful flip of resistance into support is a textbook bullish signal, and it’s holding beautifully indicating strong buyer presence and increasing the probability of continued upside.
💎If this support holds firm, #EGLD is eyeing a move toward the $18.00–$18.25 region, where moderate resistance is expected. A break above this could open the path toward the $19.90–$20.40 zone, a significant resistance level that may shape the next macro structure on this chart.
But it’s not all upside. If EGLD fails to hold the $13.00 level and especially the key invalidation point at $11.85 this entire bullish setup breaks down, and sellers will likely take control. The bullish momentum would collapse fast, and the door would open to much deeper downside levels.
MyCryptoParadise
iFeel the success🌴

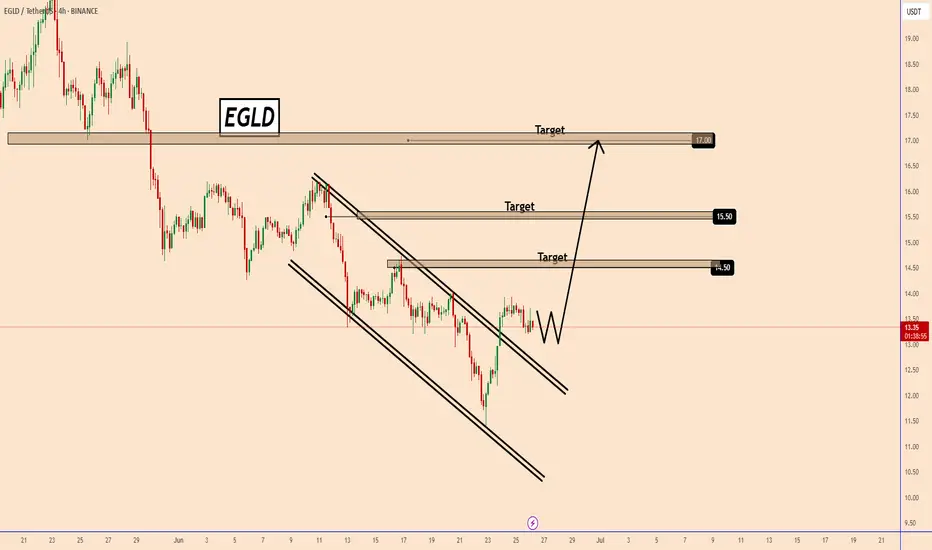
EGLD: Potential Rally as Altcoins Reclaim MomentumEGLD: Potential Rally as Altcoins Reclaim Momentum
EGLD has broken out of a clear ascending channel pattern. The move was initiated by optimism for BTC price recovery to 108k.
BTC was the first to move, and today's indicators are showing a pause in BTC.
Meanwhile, Alcoins started the move and dominated the market today. Many altcoins are very undervalued, and EGLD is one of them.
RGLD is likely to take a small pause and could rise these days to 14.50; 15.50 and 17.00 on its first move if that happens.
Later, we should re-evaluate the analysis. There is a great potential if the growth wave starts from this area.
You may watch the analysis for further details!
Thank you and Good Luck!
❤️PS: Please support with a like or comment if you find this analysis useful for your trading day❤️
Continuing pain - Continuing gainAnother gem on discount 👌
Accumulation at this prices could pay bold returns IMO.

EGLD Runs to over $1millionBetter long the new crypto kings hurrah and thank you. This will be THE LAST opportunity you ever have of this magnitude to get rich as dog **** with like 14 bucks lol

EGLD Analysisno need to say something , chart is speaking it self .Remember Ride the wave of the trend and let it guide you.
Best regards CobraVanguard.💚

EGLDUSDT 1D AnalysisEGLD ~ 1D Analysis
#EGLD Buy back gradually from here if you still have confidence in this coin with a short term target of at least 15%+ from here.

$EGLD Gearing Up for Next Leg – Bull Flag in PlayCRYPTOCAP:EGLD is forming a clean bull flag on the 6H chart after a strong move up.
Price is holding the trendline, and a breakout above $19.7 could target $27 that’s a 47% potential move.
This setup appears solid, incorporating confluence from Fib levels and volume zones.
Eyes on this breakout that could be explosive.
Flag breakout incoming?
DYOR, NFA.
#EGLDUSDT #Altseason2025

EGLD has HIGHER targets! Consolidating above the major support of $11.9- $13.12 has activated the $31.3 target for EGLDUSDT. Entering the position now could yield around 70% profit but with higher risk.

$EGLDUSDT Long Setup BINANCE:EGLDUSDT – Long Setup 🚀
TF: 1H | Pattern: Falling Wedge
Entry: $19.00–$19.20
SL: $18.53
Targets: $19.90 / $20.70 / $21.58
Bullish breakout


$EGLDUSDT Trade SetupBINANCE:EGLDUSDT Trade Setup
EGLD just broke above the resistance zone and is now retesting it as support, a classic breakout + retest structure.
Price holding above key EMAs
MACD shows bullish momentum building
Looking ready for a move toward $24+
DYRO, NFA

EGLD LOOKS BULLISHThe EGLD daily chart is looking constructive following a clean breakout above descending resistance, accompanied by a noticeable spike in volume – a classic signal of growing momentum and renewed trader interest. Price is now consolidating just under the \$19.94 resistance level, which has capped the last few daily candles. A strong close above this line would confirm continuation and likely invite more buyers.
If we do see a breakout, Fibonacci retracement levels can provide logical upside targets. The 38.2% retracement sits around \$21.68, followed by the 50% level at \$26.18 and the 61.8% zone at \$31.62. These levels may act as points of reaction or short-term resistance, but they also reflect the deeper potential of this move if strength persists.
For now, EGLD remains above its breakout level, and the recent bullish structure looks intact. However, confirmation still hinges on closing decisively above \$19.94 with continued volume support.

#EGLD/USDT#EGLD
The price is moving within a descending channel on the 1-hour frame, adhering well to it, and is heading for a strong breakout and retest.
We are seeing a rebound from the lower boundary of the descending channel, which is support at 16.80.
We have a downtrend on the RSI indicator that is about to be broken and retested, supporting the upward trend.
We are looking for stability above the 100 moving average.
Entry price: 17.32
First target: 17.65
Second target: 18.55
Third target: 19.45

#EGLD/USDT#EGLD
The price is moving within a descending channel on the 1-hour frame and is expected to continue upward.
We have a trend to stabilize above the 100 moving average once again.
We have a downtrend on the RSI indicator that supports the upward move with a breakout.
We have a support area at the lower boundary of the channel at 17.19.
Entry price: 17.82
First target: 18.26
Second target: 18.76
Third target: 19.40

MultiversX, Crypto, Stock Market, The World & Soul PsychologyThis is MultiversX in the transition period, between bear and bull market.
I don't know if you already know what I've been saying and sharing about the transition years, 2023 and 2024. Here I have the linear chart which clearly shows the difference between a bull market vs a sideways market.
After the bottom in mid-2022 all the action has been mostly neutral, sideways. There has been some bullish waves but this is nothing compared to bull market type of action. The only reason why the waves from 2023 and 2024 looks big in my other charts is because of the log. scale. When you use linear, you can see the difference.
Late 2024 we saw some bullish action. Mid-2025 is nothing like 2022, 2023 or 2024, it will be like 2021. It will be crazy.
Now, as to the chart, the candles will extend and become really big like on the left side. So all projections will be invalidated and all the charts will become distorted.
All the action from 2023 and 2024 will become almost invisible and everything will trade at new All-Time Highs. This is what you need to prepare for.
Even with a 20%, 30% rise, this is nothing, we are still at the bottom. New All-Time Highs all across (allow for the usual variations of course).
Those pairs that didn't produce a very strong correction have limited potential for growth.
Those pairs that removed 100% of all gains from previous cycles can do huge growth.
All Cryptocurrency tradings pairs have huge potential in this year 2025 and possibly beyond.
Now, we are in the bull market year but this isn't all. There will be bullish waves and bearish waves all the years, endless opportunities. Another strong bull market in 2029, 2033 and so on. It goes on and on and on. For hundreds of years.
The stock market is already hundred of years old.
The English people and the Jews used to trade with papers more than a hundreds years ago. It evolved into what we have today.
The Cryptocurrency market is only starting now and is here to stay.
The markets will evolve but nothing will be lost, we will have the usual commodities, forex (currencies), metals, stocks and Crypto. And all the other stuff that I am not familiar with, the derivatives, bonds and other type of junk.
You are a human being. You have the living spirit within you and to read this you are using a technological device, your choice is Crypto. The rest is old.
Money evolves, the world evolves, we don't fight change, we adapt and grow.
The most important ability in this reality is adaption. The market has never stop changing, nothing is permanent other than your Soul.
Namaste.

EGLD Eyes Tactical Rebound from Structural SupportEGLD remains in a defined macro downtrend since its $544 ATH, but the current price action is reacting once again at a key lateral trendline that has historically triggered major bullish rebounds. The ongoing bounce from this structural support suggests a potential short-term rally toward the $40 resistance zone.
We're positioning within the immediate demand zone, with close attention on price behavior at the nearby weak resistance, which could cap this relief move. A breakdown below this demand region, however, opens the door for deeper downside toward the critical support zone highlighted on the chart.

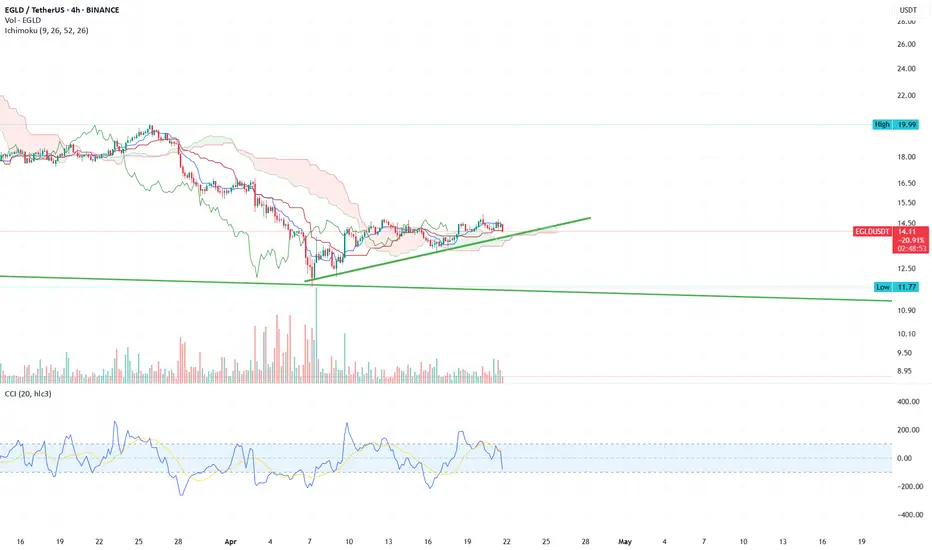
edld 📊 EGLD/USDT – 4H Technical Analysis
The price of EGLD/USDT is currently trading at $14.28, consolidating in a rising triangle pattern after a significant downtrend.
🔍 Key Observations:
Ascending trendline support is clearly holding since the April bottom, showing gradual higher lows.
Ichimoku Cloud indicates mixed signals:
Price is above the Kumo, suggesting short-term bullish momentum.
However, the cloud ahead is thin, indicating weak support/resistance levels and a potential for indecision.
CCI (Commodity Channel Index) is slightly negative around -6.91, indicating a lack of strong momentum and a possible pause or retracement.
Volume has decreased recently, showing that buyers are cautious and not yet confirming a breakout.
🧭 Key Levels:
Support: $13.44 (horizontal), $14.00 (trendline)
Resistance: ~$15.00 (local top), followed by $16.50 and $19.99 (historical high)
⚠️ Outlook:
A break above $15.00 with strong volume could confirm bullish continuation.
A break below the trendline (~$14.00) might trigger a deeper pullback toward the $13.00–$12.00 region.
EGLDUSDT 1D AnalysisEGLD ~ 1D Analysis
#EGLD Buy after successfully penetrating this resistant line with a short -term target of at least 10%+.

EGLD's situation+ Target PredictionThe EGLDUSDT is in a Bullish phase by a Falling Wedge Pattern.
-A falling wedge indicates the potential for price to reach to $23.
Note if the Wedge Pattern is broken downwards with the strength of Bearish candles , this analysis of ours will be failed.
Give me some energy !!
✨We spend hours finding potential opportunities and writing useful ideas, we would be happy if you support us.
Best regards CobraVanguard.💚
_ _ _ _ __ _ _ _ _ _ _ _ _ _ _ _ _ _ _ _ _ _ _ _ _ _ _ _ _ _ _ _
✅Thank you, and for more ideas, hit ❤️Like❤️ and 🌟Follow🌟!
⚠️Things can change...
The markets are always changing and even with all these signals, the market changes tend to be strong and fast!!

Max pain - Max gain II To be honest, I would never have expected EGLD to be at 13.8 at the same time BTC is at 83K. I will try to add some LEVERAGE at this point to boost my position.
I think in the worst case scenario we could retest the all-time low of $8 🤯
I'm not saying it will happen, I'm saying this could be the worst case scenario..

EGLD is ready to hit $30 (Short Squeeze)CRYPTOCAP:EGLD just hit its weekly demand zone and is showing a good reaction its about time it goes to $30.

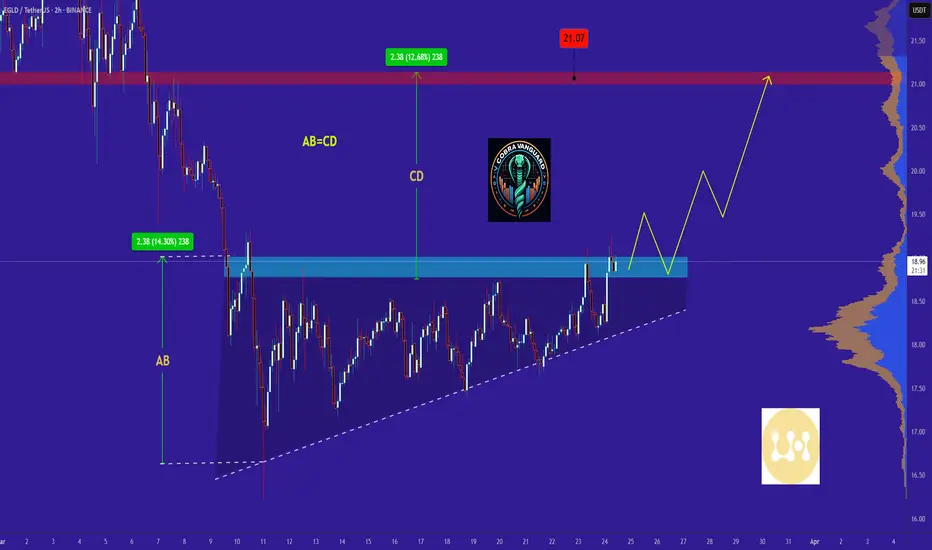
EGLD in coming days ...Currently, EGLD is forming an ascending triangle, indicating a potential price increase. It is anticipated that the price could rise, aligning with the projected price movement (AB=CD).
However, it is crucial to wait for the triangle to break before taking any action.
Give me some energy !!
✨We spend hours finding potential opportunities and writing useful ideas, we would be happy if you support us.
Best regards CobraVanguard.💚
_ _ _ _ __ _ _ _ _ _ _ _ _ _ _ _ _ _ _ _ _ _ _ _ _ _ _ _ _ _ _ _
✅Thank you, and for more ideas, hit ❤️Like❤️ and 🌟Follow🌟!
⚠️Things can change...
The markets are always changing and even with all these signals, the market changes tend to be strong and fast!!