EGLD: Speculation or bearish retest???the weekly candle is clearly bearish and retests the base of the Triangle?? / H&S ??.. that which is...
the fact is that resistance exists and the candle is a bearish Shooting star
from a non-technical point of view, EGLD is still little capitalized and is evolving as an ecosystem, so it is possible that a phase of FOMO has been discounted and therefore it is a signal of "cleaning" and not bearish
EGLDUSDT trade ideas

EGLD UpdateEGLD is a very solid project and this nice 25% trade should close out today hopefully. Pretty painless to watch this one. Plenty of growth to go but expecting resistance at the big even of $200.

EGLD entering Sell Zone$EGLD #Elrond entering the sell zone (red box) between $186-198 where the 21W EMA and the 200 day EMA are now, probably going back to touch the 50 day MA (curved red line) after getting rejected.
The "buy box" (green box) is now between $140-$150.
The game here is simple:
- Buy in the green box
- Sell in the red box
- Stop loss at $132 (or 5% below your buy price)
- Potential average profit: +30%
- Potential loss: less than -10% if you set everything properly
Bull market support band (20W SMA, 21W EMA) are now around $189 and $226 respectively, meaning until we see at least a few candles closing above $226 this is still in a downtrend.
Probably getting a MACD bearish cross by the time we reach the vertical blue line and we could even see a double top around $199/$200.
Enjoy.

EGLD DAILY ANALYSISElrond is approaching near its breakout zone. If it breaks thezone with a good volume, then we presume that it can go to as high as 220USD.
Even if it comes down for a slight pullback, there is high chance of it breaking that resistance trendline.
Like if u can relate (:

Elrond (EGLD) - March 24Hello?
Traders, welcome.
If you "follow", you can always get new information quickly.
Please also click "Like".
Have a good day.
-------------------------------------
(EGLDUSDT 1W Chart)
If the price holds above 189.78, it is expected to turn into an uptrend. (Important perspective)
Primary resistance: around 259.05
Secondary resistance: around 388.02
If the price falls below the uptrend line, there is a possibility that it will move towards the 89.17 area, so you need to trade cautiously.
--------------------------------------
(EGLDBTC 1W chart)
Above 0.001910: Expect the uptrend to continue
Above 0.0035: Expected to create a new wave.
Primary resistance: 0.004758-0.005159
Secondary resistance: 0.007040
It is important to keep the price above the 0.004228 point.
------------------------------------------------------------ -----------------------------------------------------
** All indicators are lagging indicators.
Therefore, it is important to be aware that the indicator moves accordingly with the movement of price and volume.
However, for convenience, we are talking in reverse for the interpretation of the indicator.
** The MRHAB-O and MRHAB-B indicators used in the chart are indicators of our channel that have not been released yet.
(Since it was not disclosed, you can use this chart without any restrictions by sharing this chart and copying and pasting the indicators.)
** The wRSI_SR indicator is an indicator created by adding settings and options to the existing Stochastic RSI indicator.
Therefore, the interpretation is the same as the traditional Stochastic RSI indicator. (K, D line -> R, S line)
** The OBV indicator was re-created by applying a formula to the DepthHouse Trading indicator, an indicator disclosed by oh92. (Thanks for this.)
** Support or resistance is based on the closing price of the 1D chart.
** All descriptions are for reference only and do not guarantee a profit or loss in investment.
(Short-term Stop Loss can be said to be a point where profit and loss can be preserved or additional entry can be made through split trading. It is a short-term investment perspective.)
---------------------------------

EGLD/USDT (Futures) Update Short!#harmonicsignal #Crypto
EGLD/USDT (Futures) Update
⬇️Short Signal
Entry at 196.5
⭕️SL @207
🔵TP1 @168.5
🔵TP2 @150.5
Move your SL to entry level after profit 1:1 RR hitted.
*Take out 75% at tp1 remaining for tp2*
Only Risk 1% of your Equity.

EGLD Is Going to touch 270$ once again🌳EGLD Has Done a Massive Correction! But It Seems To be Recovering From That! As You Can See The Price Has Created a Good Double Bottom Pattern. This Means When The Break out Happens, The Price Can Increase as Much as The Measured Price Movement (AB=CD which in This Case Is as Much as the Length Between The Bottom & the Top of a Bottom!) So This Means that EGLD is able to Reach 270$ Once again. But No Confirmation yet cause There is no Break out.
_ _ _ _ _ _ _ _ _ _ _ _ _ _ _ _ _ _ _ _ _ _ _ _ _ _ _ _ _ _ _ _ _
Thank you for seeing idea .
Have a nice day and Good luck

EGLD - ElrondI expect EGLD to accumulate in the area and continue its growth. First real resistance would be $360 to watch.
Momentum is in the oversold territory. Watch for a deviation in 4h-1D timeframe and expect a reversal candle to validate the price action.
Cheers ✌


🔥 EGLD Bullish Channel Update: Huge Move ComingA little while ago I made an analysis on EGLD and the long-term bullish channel it was trading in. Since my last analysis last week, EGLD has gained over 20% and is one of the major gainers of the current market.
I'm making this post to inform you that we're closing in rapidly on the $200 resistance area. This area is a previous local top, as well as an important round number. Expect traders to take profits, which will lead to a reduction in value.
The bounce down after hitting $200 might be a good time to load up in case you're planning to DCA. Keep an eye on the overall market.
Long-term target is still the top of the channe.
Happy trading!

rr=2.15crab pattern + xabcd (lvl 2.000) + divergence RSI + parallel channel + double top
=> possibility of pullback strong resistance
tp : last pic

EGLD, which is expected to form a bat form.The following content is machine translation:
Rebound to support at the trendline.
Lows and sub-low bounces are formed.
It is expected to continue to rise to complete the bat pattern.

EGLD Showing Strength Amidst General Market WeaknessBeen looking for a trade to the upside in names that showed signs of resiliency amidst the general market weakness. BINANCE:OGNUSDT and BINANCE:WAVESUSDT have been two trades I have entered prior with the same thesis. EGLD looks like the next one to find support.
I personally view the market playing capital rotation for now and if anything is outperforming everybody is going to chase that as the options to trade long is very limited at the moment.
Looking for near-term, upside at around $205 to $235. Stops below $120.
Anybody looking at this and seeing the same?

Elrond has broken, ready to riseHello my friend
Looking at the big picture for Elrond, I think he's broken and eliot will repeat again. Macd is producing buy signals on the daily chart and the reds have turned white for the weekly chart, and I expect it to turn green on the weekly chart and produce a buy signal soon. Rsi is also at the bottom of the formation and it crossed the trend for an uptrend, when I look at the indicators, I am positive and I believe it will get bull again for Elrond. There may be short-term dreams, but in the long term, the direction is up. Don't forget to follow bitcoin and stop. If you like my idea, don't forget to comment and like, it will be the best thank you for me.If you like this idea, you can also check out my ideas below.
It is not investment advice.

EGOLD USDT Resistance (Long-Term TP'S)>>>>>>>>>>>>>Hello EveryOne
I Have Tried My Best to Bring the best Possible outcome in this Chart
It's not Advise to Any Move Just For Future review
With Hopping Success>>>>>>>>>>>>>>>>>

Eggs/usdt Free signalEgld/usdt Now Can Pump if You Are Interested
Then Buy Your own risk
Target1=$170
Target 2=230
Target 3=300
Stop Lose=$120

EGLD break out from W pattern .Hello traders 🐺 .
IF you remember my last idea about the EGLD , you know that in the last idea I was talked about the long term view of the EGLD and you can find it in the Related idea down below this idea , but in this idea I want to talk about the short term view of the EGLD :
In the chart above you can see that EGLD is breaking out from the minor W pattern inside the triangle pattern and now trying to retest the neck line as a new support , and as you can see in the chart I showed you the possible path for the EGLD price and after reaching the W pattern target , EGLD will faced to a daily resistance ( blue box) which is in alignment with the triangle upper trend line and also it's a W pattern price target .
But after testing the daily resistance , EGLD may goes down again and consolidation between the daily boxes , and after that decided to break from the triangle .
If you are currently in the long position , you can puts your take profit around the daily resistance box at 180$ , but still there is chance for goes further above , so trade based on your trading strategy .

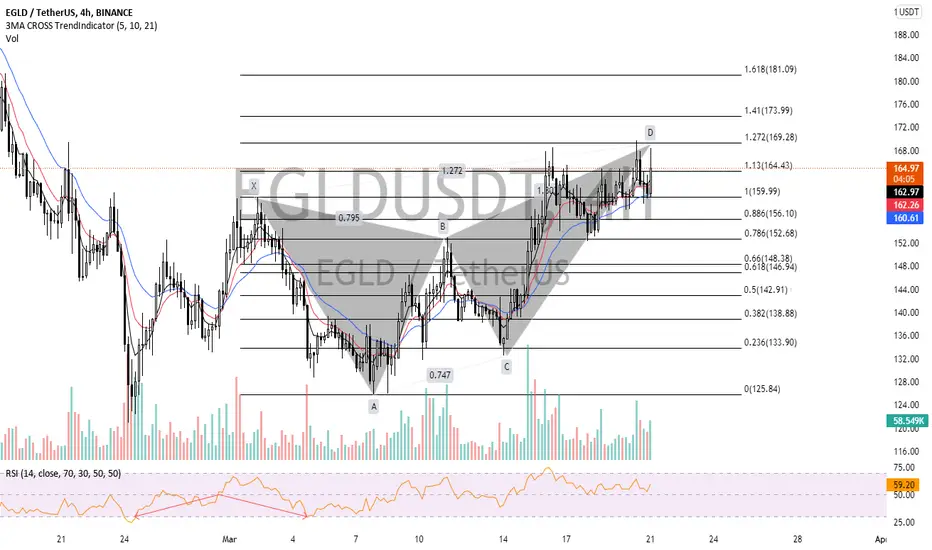
Short Signal For EGLD !#harmonicsignal #Crypto
EGLD/USDT (Futures) Update
⬇️Short Signal
Entry at 169.28
⭕️SL @173
🔵TP1 @153
🔵TP2 @142
Move your SL to entry level after tp1 hitted.
Take out 75% at tp1 remaining for tp2
Only Risk 1% of your Equity.
EGLD - NEXT MOVE UP?Hey Guys, I see a cup and handle formed and think it will break it today. What are you thinking?

EGLD Looks about to explodeBreak from wedge then retest and I expect to see it pump now if BTC can remain stable, great entry for a swing here.


EGLDUSDTDISCLAIMER:
This is not financial advice! This is an opinion-based show. I am not a financial adviser. Please only invest what you can afford to lose, and we encourage you to do your own research before investing.
everyone should buy and sell according to their own strategy.
Everything you need to know is outlined in the chart and keep in mind that we are moving forward with probabilities and the analysis may be wrong so take capital management seriously.
