EGLDMultiversX
Egld usdt Daily analysis
Risk rewards ratio >2.2 👈👌
Pattern = two bottoms
First target =21.3$
Related pairs

EGLD: Potential Rally as Altcoins Reclaim MomentumEGLD: Potential Rally as Altcoins Reclaim Momentum
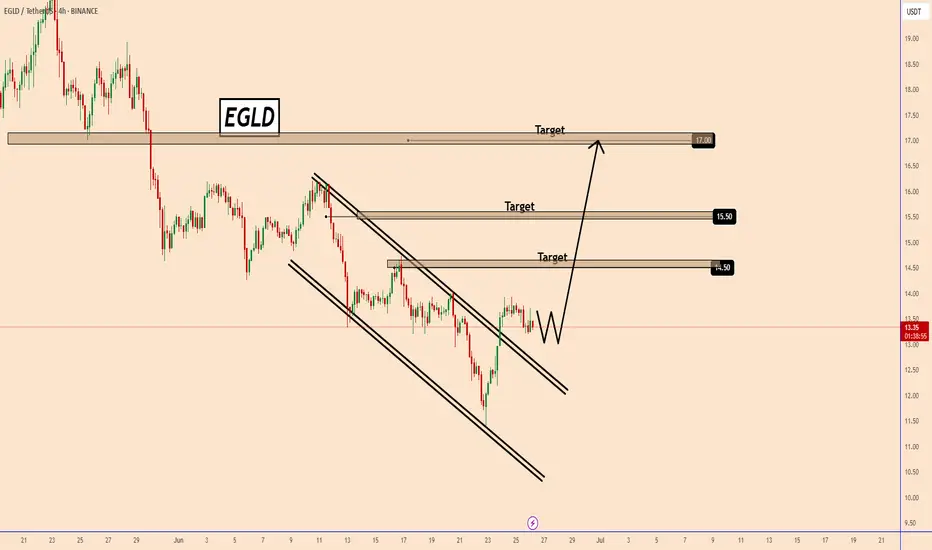
EGLD has broken out of a clear ascending channel pattern. The move was initiated by optimism for BTC price recovery to 108k.
BTC was the first to move, and today's indicators are showing a pause in BTC.
Meanwhile, Alcoins started the move and
Continuing pain - Continuing gainAnother gem on discount 👌
Accumulation at this prices could pay bold returns IMO.

EGLD Runs to over $1millionBetter long the new crypto kings hurrah and thank you. This will be THE LAST opportunity you ever have of this magnitude to get rich as dog **** with like 14 bucks lol

EGLD Analysisno need to say something , chart is speaking it self .Remember Ride the wave of the trend and let it guide you.
Best regards CobraVanguard.💚

EGLDUSDT 1D AnalysisEGLD ~ 1D Analysis
#EGLD Buy back gradually from here if you still have confidence in this coin with a short term target of at least 15%+ from here.

$EGLD Gearing Up for Next Leg – Bull Flag in PlayCRYPTOCAP:EGLD is forming a clean bull flag on the 6H chart after a strong move up.
Price is holding the trendline, and a breakout above $19.7 could target $27 that’s a 47% potential move.
This setup appears solid, incorporating confluence from Fib levels and volume zones.
Eyes on this breakout t

EGLD has HIGHER targets! Consolidating above the major support of $11.9- $13.12 has activated the $31.3 target for EGLDUSDT. Entering the position now could yield around 70% profit but with higher risk.

$EGLDUSDT Long Setup BINANCE:EGLDUSDT – Long Setup 🚀
TF: 1H | Pattern: Falling Wedge
Entry: $19.00–$19.20
SL: $18.53
Targets: $19.90 / $20.70 / $21.58
Bullish breakout


See all ideas
Summarizing what the indicators are suggesting.
Oscillators
Neutral
SellBuy
Strong sellStrong buy
Strong sellSellNeutralBuyStrong buy
Oscillators
Neutral
SellBuy
Strong sellStrong buy
Strong sellSellNeutralBuyStrong buy
Summary
Neutral
SellBuy
Strong sellStrong buy
Strong sellSellNeutralBuyStrong buy
Summary
Neutral
SellBuy
Strong sellStrong buy
Strong sellSellNeutralBuyStrong buy
Summary
Neutral
SellBuy
Strong sellStrong buy
Strong sellSellNeutralBuyStrong buy
Moving Averages
Neutral
SellBuy
Strong sellStrong buy
Strong sellSellNeutralBuyStrong buy
Moving Averages
Neutral
SellBuy
Strong sellStrong buy
Strong sellSellNeutralBuyStrong buy
Displays a symbol's price movements over previous years to identify recurring trends.
Curated watchlists where EGLDUST is featured.

Proof of Stake: Seeking validation?
26 No. of Symbols

Smart contracts: Make the smart decision
36 No. of Symbols
See all sparks
Frequently Asked Questions
The current price of EGLD / UST (EGLD) is 15.52100000 USDT — it has risen 3.18% in the past 24 hours. Try placing this info into the context by checking out what coins are also gaining and losing at the moment and seeing EGLD price chart.
EGLD / UST price has risen by 12.24% over the last week, its month performance shows a −3.22% decrease, and as for the last year, EGLD / UST has decreased by −57.71%. See more dynamics on EGLD price chart.
Keep track of coins' changes with our Crypto Coins Heatmap.
Keep track of coins' changes with our Crypto Coins Heatmap.
EGLD / UST (EGLD) reached its highest price on Nov 23, 2021 — it amounted to 546.33000000 USDT. Find more insights on the EGLD price chart.
See the list of crypto gainers and choose what best fits your strategy.
See the list of crypto gainers and choose what best fits your strategy.
EGLD / UST (EGLD) reached the lowest price of 6.44490000 USDT on Oct 7, 2020. View more EGLD / UST dynamics on the price chart.
See the list of crypto losers to find unexpected opportunities.
See the list of crypto losers to find unexpected opportunities.
The safest choice when buying EGLD is to go to a well-known crypto exchange. Some of the popular names are Binance, Coinbase, Kraken. But you'll have to find a reliable broker and create an account first. You can trade EGLD right from TradingView charts — just choose a broker and connect to your account.
Crypto markets are famous for their volatility, so one should study all the available stats before adding crypto assets to their portfolio. Very often it's technical analysis that comes in handy. We prepared technical ratings for EGLD / UST (EGLD): today its technical analysis shows the buy signal, and according to the 1 week rating EGLD shows the sell signal. And you'd better dig deeper and study 1 month rating too — it's sell. Find inspiration in EGLD / UST trading ideas and keep track of what's moving crypto markets with our crypto news feed.
EGLD / UST (EGLD) is just as reliable as any other crypto asset — this corner of the world market is highly volatile. Today, for instance, EGLD / UST is estimated as 3.96% volatile. The only thing it means is that you must prepare and examine all available information before making a decision. And if you're not sure about EGLD / UST, you can find more inspiration in our curated watchlists.
You can discuss EGLD / UST (EGLD) with other users in our public chats, Minds or in the comments to Ideas.