EGLDUST trade ideas

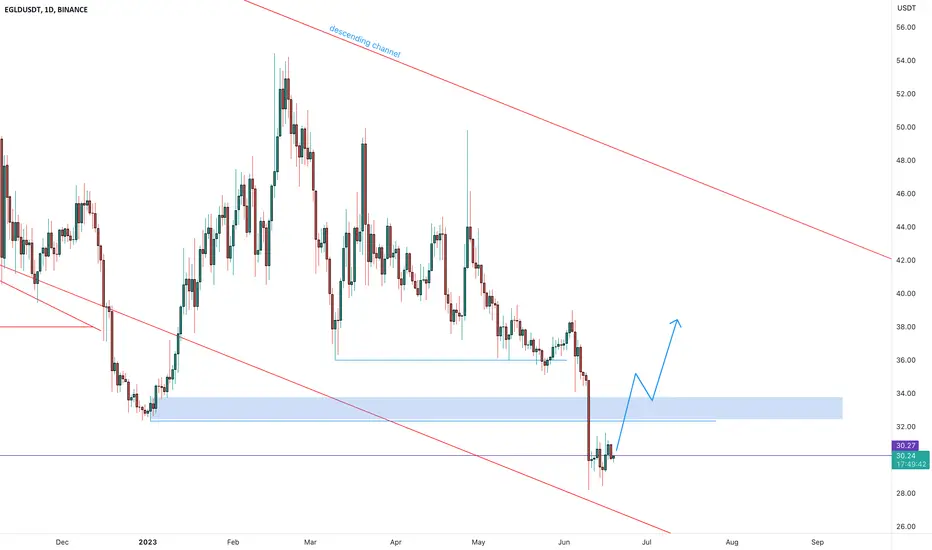
Egld is BackT1: 39
T2: 42
T3: 56+
Long term plan : Launching XMoney = 110$ / Egld
SL: 28$ and RR: 22$
Long time no see my old friend Egld.
My long term chart regarding EGLD. 100% accuracy :) ATH and ATL

elrond EGLDUSDT Price Analysis (Weekly)📈💥 Greetings, traders and investors of @TradingView! Let's dive into the analysis of elrond!
🚀 Today, EGLDUSDT finds itself in a relatively low position after experiencing a massive crash from its all-time high (ATH) at $544. The price has plummeted by nearly 95% to the $30-35 zone, where it currently resides.
🔍 When examining the weekly timeframe, we observe a bullish divergence on the RSI indicator. This suggests a potential upward movement for EGLDUSDT in the coming months, signaling a possible shift in market sentiment.
📊 It's important to consider previous support and resistance zones. Based on these levels, we can identify potential target zones for bullish momentum. The blue box on the chart indicates a target range of $54-64, while the red box represents a target range of $80-99. However, we believe that reaching the red box target has a lower probability, so take that into account when planning your trades.
💡 As always, it's crucial to stay updated on market developments, monitor price action, and employ proper risk management techniques. Set stop-loss orders and adjust your trading strategies accordingly.
🔍 Feel free to explore our resources to enhance your trading skills:
Education articles
📚📈 Curious about Bullish Divergence? Dive into our comprehensive article for a deeper understanding of this powerful indicator and how it relates to EGLDUSDT's current situation! 🚀📈
Read the Article Here ➡️
Happy trading! 💰🚀

EGLD Long idea EGLD is swiftly approaching a significant resistance level, making it crucial for astute investors to closely monitor its movement. There is a potential for a bullish reversal, presenting an opportune moment for those with a keen interest in the market.

EGLDUSDT is testing the key levelsEGLDUSDT is currently in a critical phase as the market tests the lower trendline of the weekly descending channel. Additionally, it is also testing the monthly support level, adding to the significance of this price zone. T
To witness a breakout from the current situation, it is crucial for the price of EGLDUSDT to be supported by substantial trading volume. This increased volume would indicate heightened market participation and interest, potentially leading to a bullish move.
Specifically, the daily support area around $32.50 is an important level to watch. If the market manages to gather enough volume and buyers step in to push the price above this support level, it could trigger a potential breakout. This breakout would not only provide a short-term positive signal but also align with the trading principles advocated by Plancton,
Traders following Plancton's rules would likely consider entering new long positions if the market satisfies the necessary criteria for a breakout from the aforementioned daily support area. This could signal the start of a potentially bullish phase, with the market aiming to reverse the downward trend and potentially retest higher resistance levels.
–––––
Follow the Shrimp 🦐
Keep in mind.
🟣 Purple structure -> Monthly structure.
🔴 Red structure -> Weekly structure.
🔵 Blue structure -> Daily structure.
🟡 Yellow structure -> 4h structure.
⚫️ Black structure -> <= 1h structure.
Follow the Shrimp 🦐

EGLD/USDT - MultiversX: Failure_Swing◳◱ We've detected a Failure Swing pattern on the TSXV:EGLD / CRYPTOCAP:USDT chart. This pattern is a bullish indication and could indicate a potential trend reversal. The next resistance key levels are at 38.03 | 41.13 | 48.55 and the major support zones are respectively at 30.61 | 26.29 | 18.87. It is a bullish indication and we may consider buying at the current price zone of 33.13 and targetting higher levels.
◰◲ General info :
▣ Name: MultiversX
▣ Rank: 53
▣ Exchanges: Binance, Kucoin, Bybit, Huobipro, Gateio, Mexc
▣ Category/Sector: Infrastructure - Smart Contract Platforms
▣ Overview: Elrond is a blockchain designed for high throughput and relatively fast execution speed compared to other smart contract platforms. It features Adaptive State Sharding as its scaling solution and a Proof-of-Stake (PoS) variation called Secure PoS to secure the network. Elrond also contains a WebAssembly-based virtual machine that can support the creation and execution of decentralized applications (dApps).
◰◲ Technical Metrics :
▣ Mrkt Price: 33.13 ₮
▣ 24HVol: 2,632,355.797 ₮
▣ 24H Chng: -2.415%
▣ 7-Days Chng: 1.58%
▣ 1-Month Chng: -10.25%
▣ 3-Months Chng: -21.64%
◲◰ Pivot Points - Levels :
◥ Resistance: 38.03 | 41.13 | 48.55
◢ Support: 30.61 | 26.29 | 18.87
◱◳ Indicators recommendation :
▣ Oscillators: NEUTRAL
▣ Moving Averages: STRONG_SELL
◰◲ Technical Indicators Summary : SELL
◲◰ Sharpe Ratios :
▣ Last 30D: -1.06
▣ Last 90D: -1.45
▣ Last 1-Y: -0.40
▣ Last 3-Y: 0.82
◲◰ Volatility :
▣ Last 30D: 0.64
▣ Last 90D: 0.53
▣ Last 1-Y: 0.68
▣ Last 3-Y: 1.18
◳◰ Market Sentiment Index :
▣ News sentiment score is N/A
▣ Twitter sentiment score is 0.54 - Bullish
▣ Reddit sentiment score is 0.83 - V. Bullish
▣ In-depth EGLDUSDT technical analysis on Tradingview TA page
▣ What do you think of this analysis? Share your insights and let's discuss in the comments below. Your like, follow and support would be greatly appreciated!
◲ Disclaimer
Please note that the information and publications provided are for informational purposes only and should not be construed as financial, investment, trading, or any other type of advice or recommendation. We encourage you to conduct your own research and consult with a qualified professional before making any financial decisions. The use of the information provided is solely at your own risk.
▣ Welcome to the home of charting big: TradingView
Benefit from a ton of financial analysis features, instruments and data. Have a look around, and if you do choose to go with an upgraded plan, you'll get up to $30.
Discover it here - affiliate link -

Possible RD+ in weekly timewe see possible RD+ with RSI, MACD goes weak and try to become zero and even positive. we can have some EGLD in our portfolio. I recommend to buy is spot, not future.

EGLD Wyckoff AccumulationThe present market structure of EGLD shares similar characteristics with that of a typical Wyckoff Accumulation Phase. The recent capitulation below 30$ would indicate the 'Spring' event, as mentioned in the Wyckoff theory. For the coming months, we can expect support tests on the USD pair, in range of 35-40$. Against BTC, EGLD could see levels below 0.001, as Bitcoin in the leading asset (driven by institutional buying (spot ETF's etc.)) in this class for the time being. In either Q4 '23 or Q1 '24 we can expect a breakout of the accumulation range, up to 160$ for further continuation.

Elrond historic move don’t miss out!!👀 🚀EGLD today analysis💎EGLD is ready to make a significant move. It has been trading within a descending channel for the past month, holding firm at the lower low.
💎 Currently, it's situated in a high-demand area within the channel, and the overall market positivity could signal a bullish trend. We're anticipating a breakout soon.
💎Another key point to note is that EGLD is nearing a crossover with the 50-day Exponential Moving Average (EMA). If it can sustain its momentum above this line, it could indicate a strong upward move.
💎The volume is also showing promising spikes, which could trigger a bullish move.
💎In the dynamic world of crypto, staying informed and adaptable is key. Stay tuned for more updates and enjoy your trading journey!

EGLDUSDTEVERY CANDLE HAS LIQUIDITY.
PRICE ALWAYS NEED LIQUIDITY.
Nobody Knows Where is Price Going.
Hey traders, here is the analysi.
If you guys like my analysis please hit like?? and follow.
Thanks.
DISCLAIMER- This is not financial advice.
SMART MONEY CONCEPT.
identify Liquidity Or Become Liquidity

EGLD USDT NO FOMO 🛑In the chart, you can easily see that every time EGLD reaches this trend, it immediately drops by 35%. I don't trust the trend line, because most of the trend lines are made to break, but it's better to be careful.
⚠️ Disclaimer: This chart and analysis are not meant to be, and do not constitute financial, investment, trading, or other types of advice or recommendations. #DYOR

EGLDUSDTit's doing double top now this is touching low time demand. probably this will touch next big supply zone.


EGLD 1W 6$EGLD has experienced a breakdown, indicating that both investors and sellers can continue selling. It has entered an accumulation phase, which may last for a couple of years. The nearest price target on the weekly chart could be around $6. Currently, altcoins are struggling, and even Bitcoin has not undergone a significant correction. Just imagine the impact when Bitcoin eventually experiences a correction of, for example, -20%.

EGLD/USDTAnother bullish set-up my Indicator shows me with the same conditions as shown in the previous Idea.
Would be better if we have a positive histogram in positive enviroment, but seems allright as long as the blue and green are out of The dark cloud.
Using less risk on this one.
Stay save. )))

Potential for Long-Term GrowthIn recent weeks, the EGLD currency has continued its downward trend, persisting within the midline of the descending channel following its reaction to the resistance range of $48-50. Notably, there have been numerous price collisions with the midline of the channel, indicating a high level of interaction.
Furthermore, the RSI (Relative Strength Index) currently stands at 36, suggesting a moderate level of momentum in the price movement. This reading implies that EGLD is neither significantly oversold nor overbought at the moment. It indicates a state of equilibrium or a potential period of consolidation in the market.
On the chart, there is a lack of strong indications for immediate price growth. However, it is worth noting that the EGLD price has approached crucial support levels around $35 and $32.5, which are considered short-term supports. These levels may experience positive fluctuations in the near future.
In addition, two lower supports should be taken into account: one at $28.5 and the other at the bottom of the channel at $25.5. These supports exhibit substantial reactive power, potentially capable of triggering an upward reversal in the price trend within daily timeframes.
Considering the RSI reading and the support levels mentioned, there is a reasonable expectation for favorable long-term growth within the identified price ranges. However, it is crucial to consider other factors and indicators to gain a comprehensive understanding of the market conditions and make informed trading decisions.

TRADE OF THE DAY | EGLD | 11.25% | Tracking Down In The Wedge TRADE OF THE DAY | EGLD | 11.25% | Tracking Down In The Wedge
| Targets On Chart |
We are seeing a heavy test of the local support that is looking more like a bearish pullback happening along with a descending wedge which is long term bullish but short to mid term bearish. The Bearish Divergence is a good confluence to have here to see it drop a little more to target

EGLDUSDT 1 DAY TFEGLDUSDT 1 DAY Time frame descending traingle breakout wait for confirmation entry after retest. target 1 near by 200 EMA and if it breaks then we wait for target 2

EGLD/USDT TRADE SETUP! 25% PUMP INCOMING!!Hello everyone, if you like the idea, do not forget to support it with a like and follow.
Welcome to this EGLD/USDT scalp trade setup.
EGLD looks good here. Breaks out from the falling wedge-like structure in 4hr time frame and currently retesting it. Long some here with tight stop loss.
Target1:- $38
Target2:- $41
Target3:- $44
Target:- $46
SL:- $34.80
Use low leverage:- 5x-10x
If you like this idea then do support it with like and follow.
Thank You!

EGLDUSD ❕ above the support zoneEGLD confirmed the boundaries of the support area.
The price bounced several times from the current area.
I believe that the asset will bounce again from the support and will continue to grow.


EGLD ANALYSIS (4H)Hi, dear traders. how are you ? Today we have a viewpoint to BUY/SELL the EGLD symbol.
For risk management, please don't forget stop loss and capital management
When we reach the first target, save some profit and then change the stop to entry
Comment if you have any questions
Thank You
