EGLD Elrond LONG TRADE 20221017Structure Breakout and AB-CD
EGLDUSD, Elrond, EGLD, EGLDUSDTP, EGLDUSDT, CRYPTO, CRYPTOCURRENCY
DISCLAIMER
This is only a personal opinion and does NOT serve as investing NOR trading advice.
Please make your own decisions and be responsible for your own investing and trading Activities.
EGLDUST trade ideas

EGLD/USDTegld/usdt
According to their our analyze, EGLD price can reach a range of $75 – $80 by the end of 2022.
his first target 66.10$
the seconde 79.05$
stay tuned for more #EGLD/USDT update

EGLD new wave?From a technical point of view, if most of the coins are on the chart at point A and falling down, then EGLD has started to go in front of the market, has passed through the 50th and 100th MA and trying to hold above them, which is already a positive sign. We would wait for more consolidation with going up and potential targets of $59, $68, this scenario is relevant as long as we are above the 50 MA.
EGLD is the native coin of the Elrond blockchain, used to pay on-chain fees, staking, and reward network validators. The Elrond project itself is not only a smart blockchain, but also a technology ecosystem for the new internet, which includes fintech, decentralized finance and the Internet of Things. In a sense, the project token will correlate with the successful development of the project. The entire ecosystem still has development potential, a significant number of projects can still be released in this network through its own launchpad with the support of Morningstar Ventures as one of the main investors in the project.

EGLDUSDT may fall a bit This is my ideea on EGLD/USDT,
There is a lot of liquidity in the down side ready to be taken,
and this may lead to a 5$ crash to EGLD

EGLDUSDT | IMPORTANT LEVELEGLDUSDT has broken above the symmetrical triangle.
The price has been trading near the horizontal resistance.
The bulls are in control.
Manage your trades accordingly.


EGLD 1H Another Triangle Break OutAnother triangle on EGLD. Who said that triangles does not work. See, easy to daytrade as always. Break Out.
? For sure this can fail because of btc correction :)_


EGLD 1H Ascending triangleWill this go up?
+ 1D resistance + support zone
+ 1H Ascending triangle
+ Local uptrend line
+ Local support
Waitin for btc move:
? BTC ? :S
Can go 19 000..

EGLD: Possible retest of broken resistanceAfter the breakout of both the trendline and the resistance, EGLD has entered an upward channel. A channel like this often breaks out downwards. It will also be healthy if EGLD retests the breakout of the resistance, which should now act as support. I therefore see a short opportunity towards a price value of $51.

EGLD/USDTEGLD/USDT
It is in a descending channel.
The ceiling of the channel has broken upwards and if it can break the resistance of $60, it can increase the price to the $100 area.
#EGLDUSDT #EGLD #BTCUSDT #BTC #ETHUSDT #DOGE #DOGEUSDT

Egld/USDT Short📉N.B. Follow me for more analysis
Trading proposals post based on price action,
technical analysis, major intraday supports
and resistances, rejections, breakouts, chart
patterns and other factors.
How this analysis was done:
First I find usdt pairs using crypto screener then if all Three×3 in 1 indicators gives main entry confirmation at the same time I go with the analysis then I find Support and Resistance zones in 3x entry timeframe also using one of the three indicators for backing up my analysis and filter bad signals then I also make trendlines using two of the 3 indicators in 3x entry timeframe for filter out more bad signals then again using one of the 3in1 indicators I filter fake breakout in entry timeframe and in higher time frame and then if other minor conditions is confirmed the analysis is done.
Take Profit:
Blue zone is potential reversal zone
Take profit is dynamic/trailing stop loss/take profit
Stoploss:
Stoploss is above/below swing high /low
Trading and investment in the financial
markets always involves high risk, So In order
to succeed using our signals make sure you
have learned the essential skills for money and
risk management
To SUPPORT this channel, please press the
LIKE button, COMMENT and Share with your
friends

EGLDUSDTHello Crypto Lovers,
Mars Signals team wishes you high profits.
This is a one-day-time frame analysis for EGLDUSDT
In the current chart, we see R1 as our resistance area that includes the unsuccessful attempts of the price to rise. S1 used to be a resistance area and S2 is a support area at the bottom of the chart. Hence, the price is fluctuating below R1 and our expectation would be a little rise for it to reach the height of this area and there we should receive some falling signs in order to activate the short position and predict a decline up to S1 or lower than that. It is not so probable for the price to rise over R1.
Warning: This is just a suggestion and we do not guarantee profits. We advise you to analyze the chart before opening any positions.
Wish you luck

EGLD analysisHello dear traders and my subscribers 👥, please if you like ideas do not forget to support it with your boost 🚀 , thank you so much and we will start
EGLD is now retesting the $54.15-$55 area. If the price break below $54 then we see a downward move toward the local support of the $51-$51.40 area. The major support is $45.30-$46.80 area. The next resistance is the $58.70-$59.80 area. Use tight stop loss if you planning to open a long position here.

Good short scalp entryWe broke down from the support and now we are heading to break some other supports that ale close to this price. I'm looking for 52 - 50 retest before new rally. Last long scalp ended extremely good with smashing that pump right after entry. Enter short somewhere here and wait for it. For more signals like and follow me

Elrond Bullish RSI Divergence Calls For at Least $10 RallyElrond (EGLD) has printed a bullish RSI divergence that supports more upside, at least until the next resistance around the $63 level is retested again. Additionally, Elrond is showing relative strength compared to the overall cryptocurrency market. These two technical factors combined offer a short-term bullish outlook for the Elrond price.
Bullish RSI Divergence
A strong bullish divergence between EGLD and the Relative Strength Index (RSI) oscillator was observed at the bottom of the current range near the $47 support level. The rally that emerged afterward doesn't seem to be running out of steam.
Moreover, the price has developed the bullish RSI divergence in multiple time frames, indicating a potential bigger bounce.
The path of least resistance is to the upside, as there are no clear resistance levels until the area between $63 and $65.
EGLD Relative Strength
Another divergence between the EGLD price and the Altcoin Index shows that Elrond is stronger than the overall crypto market. While EGLD's price broke above the mid-September high, printing a higher high, the Altcoin index continues to trade below its mid-September high.
The divergence between EGLD and the Altcoin index may be just a short-term anomaly. Because we're still trading within a bearish cycle, this may be just a pullback, and sooner or later, EGLD could align back with the overall market direction.

EGLDUSDTPERIs the eGold (EGLD) coin a good investment? Yes, the eGold (EGLD) coin is a good investment, according to several experts. The expectations for the long term, like in the Elrond (EGLD) price predictions for 2025, are that this coin will reach $750–$900 by this time.

EGLDUSDT 1D
Currently, the price is in the range of important resistance.
The first scenario is to have a price fluctuation between the range of 51/55 dollars. It is important to maintain the first support level of $51 and continue its positive trend.💹
If the price breaks from this range with a good volume, the stabilization above the range of $57 , we may see growth up to the resistance of $63.
The second scenario is if the price corrects and breaks the 51 dollar range, we will see further correction to the important support range of $46
what do you think about it? 🙂

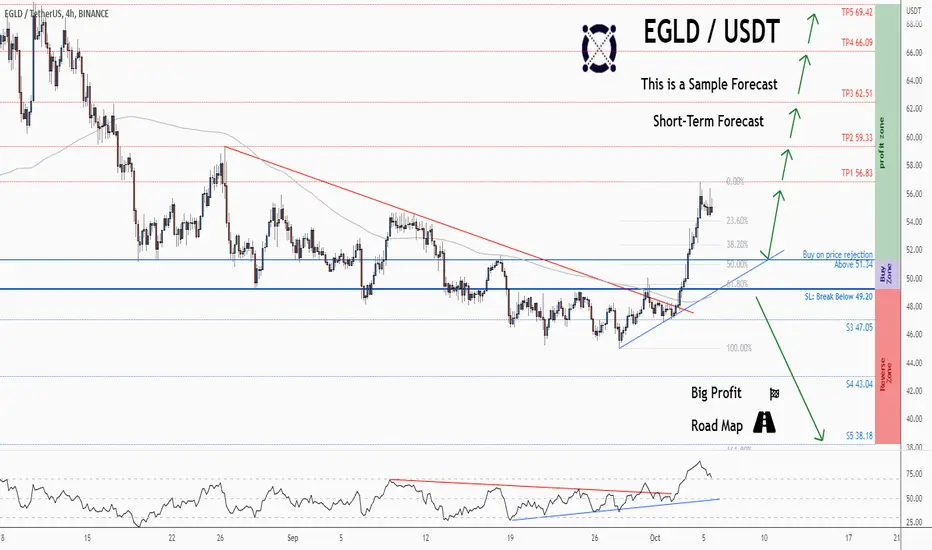
💡Don't miss the great buy opportunity in EGLDUSD @ElrondNetworkTrading suggestion:
". There is a possibility of temporary retracement to the suggested support line (51.34).
. if so, traders can set orders based on Price Action and expect to reach short-term targets."
Technical analysis:
. EGLDUSDT is in an uptrend, and the continuation of the uptrend is expected.
. The price is above the 21-Day WEMA, which acts as a dynamic support.
. The RSI is at 72.
Take Profits:
TP1= @ 56.83
TP2= @ 59.33
TP3= @ 62.51
TP4= @ 66.09
TP5= @ 69.42
SL= Break below S2
❤️ If you find this helpful and want more FREE forecasts in TradingView
. . . . . Please show your support back,
. . . . . . . . Hit the 👍 LIKE button,
. . . . . . . . . . Drop some feedback below in the comment!
❤️ Your support is very much 🙏 appreciated!❤️
💎 Want us to help you become a better Forex / Crypto trader?
Now, It's your turn!
Be sure to leave a comment; let us know how you see this opportunity and forecast.
Trade well, ❤️
ForecastCity English Support Team ❤️
💡Don't miss the great buy opportunity in EGLDUSD @ElrondNetworkTrading suggestion:
". There is a possibility of temporary retracement to the suggested support line (51.34).
. if so, traders can set orders based on Price Action and expect to reach short-term targets."
Technical analysis:
. EGLDUSDT is in an uptrend, and the continuation of the uptrend is expected.
. The price is above the 21-Day WEMA, which acts as a dynamic support.
. The RSI is at 74.
Take Profits:
TP1= @ 56.83
TP2= @ 59.33
TP3= @ 62.51
TP4= @ 66.09
TP5= @ 69.42
SL= Break below S2
❤️ If you find this helpful and want more FREE forecasts in TradingView
. . . . . Please show your support back,
. . . . . . . . Hit the 👍 LIKE button,
. . . . . . . . . . Drop some feedback below in the comment!
❤️ Your support is very much 🙏 appreciated! ❤️
💎 Want us to help you become a better Forex / Crypto trader ?
Now, It's your turn !
Be sure to leave a comment; let us know how you see this opportunity and forecast.
Trade well, ❤️
ForecastCity English Support Team ❤️

EGLDUSDT | SELL ON BREAKEGLDUSDT has broken below the rising support.
The price is currently at horizontal support.
Where bears looks in complete control now.
The break below will give strength to bears.
Trade your levels accordingly.

EGLDUSDT Massive break above the 1D MA100.*** ***
For this particular analysis on Elrond we are using the EGLDUSDT symbol on the OKX exchange.
*** ***
The idea is on the 1D time-frame where EGLD broke above the Falling Wedge pattern that it has been trading in for a little less than 2 months. The most important development however is that today it broke above its 1D MA100 (green trend-line) for the first time since August 14. If the price manages to close the 1D candle above it, it will be the first time to do so since April 19!
That would be on its own a massive bullish signal for the token as technically the next long-term target would be the 1D MA200 (orange trend-line), even though there are two Resistance levels involved (59.10 and 69.70) that shorter term traders can target.
Be careful however of the 1D RSI entering the Resistance Zone that has been holding throughout the whole year. A rejection there should make you consider taking profits earlier. On the positive side, the 1D MACD is on a strong Bullish Cross.
-------------------------------------------------------------------------------
** Please LIKE 👍, SUBSCRIBE ✅, SHARE 🙌 and COMMENT ✍ if you enjoy this idea! Also share your ideas and charts in the comments section below! This is best way to keep it relevant, support me, keep the content here free and allow the idea to reach as many people as possible. **
-------------------------------------------------------------------------------
You may also TELL ME 🙋♀️🙋♂️ in the comments section which symbol you want me to analyze next and on which time-frame. The one with the most posts will be published tomorrow! 👏🎁
-------------------------------------------------------------------------------
👇 👇 👇 👇 👇 👇
💸💸💸💸💸💸
👇 👇 👇 👇 👇 👇
