EGLD: Descending TriangleMain Pattern: Weekly Descending Triangle
A broke below 121 and 115 may confirms the descending triangle
EGLDUST trade ideas

Elrond EGLD short Price Targets and Stop LossEGLD/USDT short
Entry Range: $121 - 131
Price Target 1: $116
Price Target 2: $107
Price Target 3: $95
Stop Loss: $141

EGLD update 28.04.2022EGLD support and resisstance levels (ressistance levels are invalidated if the price makes a lover low) + potential local bottom (level on fib time, as you can see in the past, in the previous levels we had short term bottoms). Strong support between 98$ and 83$.

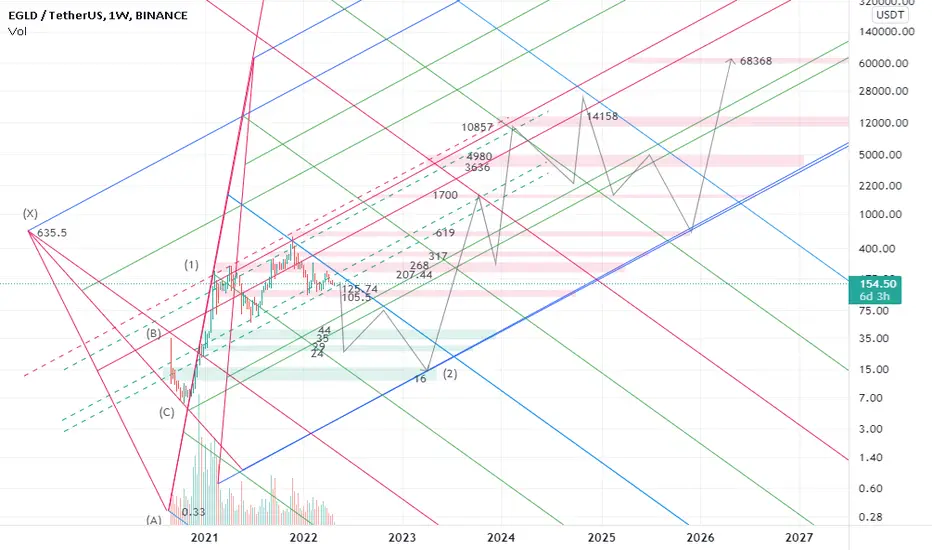
ELROND in the beginning of the 2nd wavecrab harmonic pattern:
X=$635.5
A=$0.33
AB=0.61 XA
BC=0.38 AB
0.78 BC=$24
0.88 BC=$29
0.61 XA=$35
1.13 BC=$44
1.6 BC=$105.5
0.78 XA=$125.74
2 BC=$207.44
0.88 XA=$268
2.24 BC=$317
2.6 BC=$619
1.13 XA=$1700
3.6 BC=$3636
1.27 XA=$4980
4.23 BC=$10857
1.41 XA=$14158
1.6 XA=$68368
EGLD longEgld in the channel. Breakout on the upside of the low egld channel go to another level. On fibonacci 1.618% !

EGLDUSDT, The price break this support levelHello everybody
EGLD is one the most powerful project that is working on ... . (Fundamental is good for investing)
According to the chart and the condition of the market, We expect that the price can break this support trendline level becuase the angle and the condition of the trendline isnt good as the market expect it and in days later we have FOMC EVENT that they wanna rise the rate of central bank and this means the markets the all markets ready to fall down.
If you want to take in position observe to capital management and dont forget tu use stop loss
If you need any help or wanna be our MEMBERSHIP ---> Send us messages
Good Luck
Abtin
Previous analysis :

Egld analysis You have major levels, minor levels
Purple surfaces are major surfaces and orange surfaces are minor surfaces
Given that we have had a drop from the major level, we can wait for a pattern like the one drawn. This currency code has a lot of good news over the next month, and I think the range
$ 114_129 can be a good range to buy this currency, and if the downtrend fails, it can go up to at least $ 218_248, and the longer-term targets in that range will be: $ 430_547

Could be a rising wedge on 1WFundamentally I see nothing wrong with Elrond but the price is mostly mirroring BTC (with a slight delay) so if BTC price drops I expect to see a drop to the orange line (with maybe a wick lower) and then a bounce back.

Eyes on the prize!Our Weekly trend has been on point since April-June 2021. I believe we have retouched our trend.
Patience always win and with Elrond I see us winning!
Trade safely! DYOR.

EGLD BULLISH??You must heard about EGLD coin. This coin has potential for the long term but as you know the whole market is volatile that's why egld is down but you can make quick profit for sometime by doing long on egld.
Why do long only?
There are certain reasons for that:
1) Egld coin is respecting that blue colour trendline from more than a month and now that trendline is already broken. ✅
2) RSI showing oversold that's why I am seeing RSI bullish for sometime. ✅
3) The 45 Ma is going to give support after some candles.
4) Triangle that is of orange colour is already formed and ready to break.
Now first to conditions are already fulfilled we have to wait little bit to see if another 2 conditions have met than we can do long.
Strategy:
You can take your entry after the breakout of triangle. I'll wait sometime to secure my long position because it can be a takeout also so I suggest you to take entry on my given entry of price. Now there will be 2 TPs, 1 TP is before that red line resistance zone and 2nd at top of the parallel channel. The SL will be set below the triangle.
Clear Points:
Entry : 166 (100%)
TP 1 : 170 (50%)
TP 2 : 176 (50%)
SL : 161 (100%)
NOTE: Don't take trade if the breakout happens in downward direction.

EGLD is Bullish??You must heard about EGLD coin. This coin has potential for the long term but as you know the whole market is volatile that's why egld is down but you can make quick profit for sometime by doing long on egld.
Why do long only?
There are certain reasons for that:
1) Egld coin is respecting that blue colour trendline from more than a month and now that trendline is already broken. ✅
2) RSI showing oversold that's why I am seeing RSI bullish for sometime. ✅
3) The 45 Ma is going to give support after some candles.
4) Triangle that is of orange colour is already formed and ready to break.
Now first to conditions are already fulfilled we have to wait little bit to see if another 2 conditions have met than we can do long.
Strategy:
You can take your entry after the breakout of triangle. I'll wait sometime to secure my long position because it can be a takeout also so I suggest you to take entry on my given entry of price. Now there will be 2 TPs, 1 TP is before that red line resistance zone and 2nd at top of the parallel channel. The SL will be set below the triangle.
Clear Points:
Entry : 166 (100%)
TP 1 : 170 (50%)
TP 2 : 176 (50%)
SL : 161 (100%)
NOTE: Don't take trade if the breakout happens in downward direction.

Elrond longElrond bounced off the ascending trendline and the support area. Asset broke through the descending trendline. Bullish movement to resistance level at 203 is expected to happen.

EGLDUSDT Wants to have a breakout from the Weekly resistanceThe price got a rejection from the weekly resistance on 164$ and not the price is creating another bull flag above the previous descending channel
the price retested the previous dynamic resistance as new support exactly at 0.618 Fibonacci level.
How to approach?
The price needs to have a breakout from the weekly resistance and descending channel. Beware to the left, you can find the supply zone. So if the price is going to have a breakout, According to Plancton's strategy , we can set a nice order
–––––
Keep in mind.
🟣 Purple structure -> Monthly structure.
🔴 Red structure -> Weekly structure.
🔵 Blue structure -> Daily structure.
🟡 Yellow structure -> 4h structure.
–––––
Follow the Shrimp 🦐

Will EGLD do this?if the bitcoin price will be stabil or increase the bitcoin price than we can be see egld moving.

EGLD is the last deep price??As you see the graf of egldusdt, there are three TP's;
TP1: 177.06,
TP2: 196.62,
TP3: 211.84.
if it passes TP3 its will be going to red line, they price are 252 or 270 dolars.
Good luck.

EGLDUSDT ready to explode? 💣The price created a triple bottom on the daily support on 159% as you can see on the upper chart.
On the 4h timeframe the price bounced exactly on the 0.886 Fibonacci level and dynamic support. The price got liquidity and had a breakout from the descending Channel. Now the price is testing the weekly resistance as new support
How to approach?
The price needs to have a breakout form the 170$ with Volumes and Momentum, According to Plancton's strategy , we can set a nice order
–––––
Keep in mind.
🟣 Purple structure -> Monthly structure.
🔴 Red structure -> Weekly structure.
🔵 Blue structure -> Daily structure.
🟡 Yellow structure -> 4h structure.
–––––
Follow the Shrimp 🦐

EGLD ANALYSISEGLD has been on a downtrend and has retraced to $112 from the $545 peak. Now it is forming what we call the converging Elliot wave which usually happens at the end of a trend.
As you can see in the chart it has respected the line and it is heading toward $190.
The Stochastic RSI confirms this hence bullish.
Place you buy around $150 - 155 and set your stop loss at $120 for mid-long term.

💡Don't miss the great buy opportunity in EGLDUSD @ElrondNetwork
Trading suggestion:
". There is a possibility of temporary retracement to the suggested support line (157.72).
. if so, traders can set orders based on Price Action and expect to reach short-term targets."
Technical analysis:
. EGLDUSDT is in a range bound, and the beginning of an uptrend is expected.
. The price is below the 21-Day WEMA, which acts as a dynamic resistance.
. The RSI is at 59
Take Profits:
TP1= @ 171.38
TP2= @ 182.99
TP3= @ 196.86
TP4= @ 214.65
TP5= @ 231.65
SL= Break below S2
❤️ If you find this helpful and want more FREE forecasts in TradingView
. . . . . Please show your support back,
. . . . . . . . Hit the 👍 LIKE button,
. . . . . . . . . . Drop some feedback below in the comment!
❤️ Your support is very much 🙏 appreciated! ❤️
💎 Want us to help you become a better Forex / Crypto trader ?
Now, It's your turn !
Be sure to leave a comment; let us know how you see this opportunity and forecast.
Trade well, ❤️
ForecastCity English Support Team ❤️

💡Don't miss the great buy opportunity in EGLDUSDT
Trading suggestion:
". There is a possibility of temporary retracement to the suggested support line (157.72).
. if so, traders can set orders based on Price Action and expect to reach short-term targets."
Technical analysis:
. EGLDUSDT is in a range bound, and the beginning of an uptrend is expected.
. The price is below the 21-Day WEMA, which acts as a dynamic resistance.
. The RSI is at 59
Take Profits:
TP1= @ 171.38
TP2= @ 182.99
TP3= @ 196.86
TP4= @ 214.65
TP5= @ 231.65
SL= Break below S2
❤️ If you find this helpful and want more FREE forecasts in TradingView
. . . . . Please show your support back,
. . . . . . . . Hit the 👍 LIKE button,
. . . . . . . . . . Drop some feedback below in the comment!
❤️ Your support is very much 🙏 appreciated! ❤️
💎 Want us to help you become a better Forex / Crypto trader ?
Now, It's your turn !
Be sure to leave a comment; let us know how you see this opportunity and forecast.
Trade well, ❤️
ForecastCity English Support Team ❤️

🔥 EGLD Bounce From Long-Term supportSeeing today's big green candle, I think we correctly called the reversal area. For now, I think we're likely going to trade bullish until we reach the previous double top area around $200. Unclear what will happen after that. If BTC will continue to trade bullish we might finally take a shot at $300 or more.
Always do your analysis before making a trade.

🔥 EGLD Bounce From Long-Term supportAround two weeks ago I made an analysis on EGLD and the long-term channel it was trading in. Here I argued that we'd most likely see more bearish pressure in the short-term and that we'd find support at the long-term bullish support line on the bottom of the pattern.
Seeing today's big green candle, I think we correctly called the reversal area. For now, I think we're likely going to trade bullish until we reach the previous double top area around $200. Unclear what will happen after that. If BTC will continue to trade bullish we might finally take a shot at $300 or more.
Happy trading!

EGLD about to breakout important istatic and down trendEGLD about to breakout important istatic and down trend after that we can long it to next targets i marked ,make sure comment below your ideas ...PEACE

EGLD DOUBLE BOTTOM???Elrond is hinestly one of the best projects I know. I remember when it was $20 .
Team behind this project is insane,they have really active community, so much things to offer on their blockchain and they are constantly posting something new and launching new stuff that hasnt been seen before.
Back to charts,
Elrond didnt had choch(change of character ) and didnt break previous high. But if you take in consideration that it was liqudation wick it is understandable.
Homever I think that pullback will continue to $130 area ,possibly create double bottom and maybe make new ATH.
BTC ta and USDT.D ta that you can find links below this chart also confirms this.
Elrond is probably even best project you can invest for long term,hands down to hard working team.
THIS IS NOT FINANCIAL ADVICE. DYOR
