I told you to buy egld at 25CRYPTOCAP:EGLD i advice you to buy Egold earlier at 25$, it is still in the trend and likely to make breakout soon, if this breakout happen #EGLD might 37-39$ in this week.
EGLDUST trade ideas

NOTHING !!EGLD is forming a falling wedge on Daily timeframe , Up we go if we do breakout.
✨We spend hours finding potential opportunities and writing useful ideas, we would be happy if you support us.
Best regards CobraVanguard.💚
_ _ _ _ __ _ _ _ _ _ _ _ _ _ _ _ _ _ _ _ _ _ _ _ _ _ _ _ _ _ _ _
✅Thank you, and for more ideas, hit ❤️Like❤️ and 🌟Follow🌟!
⚠️Things can change...
The markets are always changing and even with all these signals, the market changes tend to be strong and fast!!

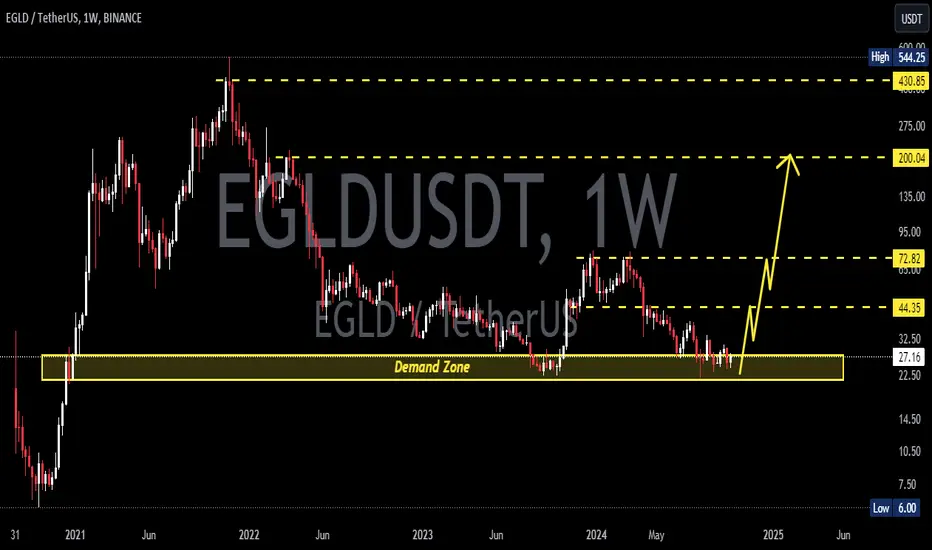
EGLDUSDTEGLD ~ 1W
#EGLD so far maintaining this demand zone.
Make purchases in stages with a short term target of at least 20%+ from here.
EGLD bullish falling wedge and triple bottom formation.CRYPTOCAP:EGLD i mentioned in my previous analysis of #egld that egld will be bullish soon, egld was moving in falling wedge chart pattern and now it has made another bullish indication "Triple Bottom" this bullish indication will lead EGLD to above 40$ soon.

EGLD - Time to buy again!EGLD is forming a falling wedge on Daily timeframe , Up we go if we do breakout.
✨We spend hours finding potential opportunities and writing useful ideas, we would be happy if you support us.
Best regards CobraVanguard .💚
_ _ _ _ __ _ _ _ _ _ _ _ _ _ _ _ _ _ _ _ _ _ _ _ _ _ _ _ _ _ _ _
✅Thank you, and for more ideas, hit ❤️Like❤️ and 🌟Follow🌟!
⚠️Things can change...
The markets are always changing and even with all these signals, the market changes tend to be strong and fast!!

EGLD will breakout soonCRYPTOCAP:EGLD offering best price to fill your spot bag, EGLD is moving in bullish chart pattern falling wedge and its looking it has completed its cycle and now it is making its move for breakout from this trend.
Buy signal EGLD/usdt
entry 24.5-26$
for spot holder targets are above 40$ and the highest target as per t.a is 55-57$
Future traders can book there accordingly
stoploss 22$

EGLD Outlook after the Dip. What to expect NOW ?BINANCE:EGLDUSDT
EGLDUSDT is forming a falling wedge on Daily timeframe , Up we go if we do breakout.
According to Elliott's theory, the double combo waves have ended and it means that the price can increase.
Also a bullish Divergence (RD+) on MACD which shows Positive Signs for EGLD.
✨Traders, if you liked this idea or have your opinion on it, write in the comments, We will be glad.
_ _ _ _ __ _ _ _ _ _ _ _ _ _ _ _ _ _ _ _ _ _ _ _ _ _ _ _ _ _ _ _
✅Thank you, and for more ideas, hit ❤️Like❤️ and 🌟Follow🌟!
⚠️Things can change...
The markets are always changing and even with all these signals, the market changes tend to be strong and fast!!

EGLDUSDT Mid term Road MapBINANCE:EGLDUSDT
EGLD is forming a falling wedge on Daily timeframe , Up we go if we do breakout.
✨Traders, if you liked this idea or have your opinion on it, write in the comments, We will be glad.
_ _ _ _ __ _ _ _ _ _ _ _ _ _ _ _ _ _ _ _ _ _ _ _ _ _ _ _ _ _ _ _
✅Thank you, and for more ideas, hit ❤️Like❤️ and 🌟Follow🌟!
⚠️Things can change...
The markets are always changing and even with all these signals, the market changes tend to be strong and fast!!

EGLD LongI believe that the market is now finishing accumulation and we will see localized asset growth in October.
The growth is based on pre-election expectations and upcoming Christmas rally.
In particular, the asset EGLD has a local target before exceeding a couple of tops.
The risk-reward of the medium-term forecast is 1 in 10.

EGLDUSDTEGLD ~ 1W
#EGLD so far maintaining this demand zone.
Make purchases in stages with a short term target of at least 20%+ from here.

#EGLDUSDT #1D (ByBit) Big falling wedge breakoutMultiversX (f.k.a. Elrond eGold) looks good for bullish continuation on daily after regaining 50MA support, road to 200MA resistance seems next.
⚡️⚡️ #EGLD/USDT ⚡️⚡️
Exchanges: ByBit USDT
Signal Type: Regular (Long)
Leverage: Isolated (2.0X)
Amount: 5.0%
Current Price:
35.91
Entry Targets:
1) 34.56
Take-Profit Targets:
1) 48.29
Stop Targets:
1) 27.68
Published By: @Zblaba
CRYPTOCAP:EGLD BYBIT:EGLDUSDT.P #1D #Elrond #eGold #MultiversX multiversx.com
Risk/Reward= 1:2.0
Expected Profit= +79.5%
Possible Loss= -39.8%
Estimated Gaintime= 1-2 months

Long In MultiversX ,EGLD After hitting the oversold zone, it seems that multiverX is going to generate a trend change in the 20-period weighted average, which could take us to the $40 zone.
Good luck!

EGLD investors stuck staking while their coin plummets to $1Yep, Doge was supposed to jump at the 6-2-4 but BTC and Doge decided to skip to the 3-2-6 on purpose to stick it to the greed coins. Plus, after 3 billion of shorts just created a slab of concrete under Doge, why would he want to leave? Justice is served, for now. Until the next pray leaves his door open, case is closed for this one.

The Elrond Swing-and-MissShe'll dip to $3 and plateau at $300 within ten minutes. She'll also remain empty software for the rest of her life. Guess whatever was supposed to jump in liked the idea of riding Doge's shorts up rather than paying the thief off. Dunno....
- Antizma

Plateau Coin EGLD plummets from $624 to $2 and back to $6500 Get your hits in on this one while you can. This is the sister coin to BTC and will make you richer than farmer with a golden goose. Enjoy, and don't say I didn't tell you so
yOURs tRULy,
- antizma a.k.a `RA.M_F.AM`

#EGLD/USDT breaks the Diagonal Trendline in 4-Hour TF!#EGLD/USDT breaks the Diagonal Trendline in 4-Hour TF!
CRYPTOCAP:EGLD is looking bullish. The local resistance level is PWH $28.4 and the support level is PDL $25.14.

MultiversX to survive the crypto graveyard eventGuess this was a good one! She should skyrocket starting today and be one of the crypto survivors. Among those who won't be living more than a week or two from today: Matic, Ethereum, Solana, TRX, and many others. Expect major crackdowns in the crypto industry soon. This next few days is going to be either a trashing or a lifetime Christmas party. Here come the gains (and the losses lol). Happy trading fellers
Note:
XRP .55 - $200
Doge .10 - $25
BTC 55k - $80
(EGLD I'm not sure of, but expect gains like DOGE and XRP)

EGLD Coming soon📈 Elrond (EGLD) is showing strong bullish signals! After a steady uptrend, we're spotting a classic bullish flag pattern, which could suggest another leg up is coming soon. Here's why this setup looks promising:

EGLD Price AnalysisThe EGLD daily chart presents a clear picture of a market in a downtrend, a descending trendline (Black) that has been consistently pushing prices lower since March 2024. This trendline, marked in red on the chart, serves as a dynamic resistance level, with the price making multiple attempts to break above it, but each time facing rejection. As the price approaches this trendline again, the market is at a critical point where a breakout could signal a potential trend reversal, while another rejection might lead to further declines.
Above the descending trendline (Black) lies a significant resistance level at $32.85. The price has to break through from this level and the descending trend line for bullish moves. This area is very important for the price to break out because you can see there are 3 resistances at the same area.
Descending Trendline (Black)
$32.85 Resistance Level
EMA 100 (Red)
These 3 resistances making this are very important. There are many other important resistance levels and zones marked on the chart to watch closely. Previously these levels made a strong barrier against the price.
On the downside, several key support levels could play a crucial role in determining the market's next move. The most immediate support is found in Green at $25.60 to $26.52 zone. This area has been tested multiple times and has held strong, making it a critical level for the bulls to defend. A break below this zone could trigger a deeper decline, possibly down to the next support zone (Yellow) at $21.72 to $22.47. This lower zone represents a long-term support area and could act as a final line of defense before a significant bearish continuation.
If the price is hovering near the trendline without a clear breakout or breakdown, it might be prudent to wait for a more definitive move. This approach reduces the risk of entering a trade during a period of uncertainty.
Overall, the EGLD is at a critical juncture, with the descending trendline and key support zones likely to dictate the next significant move in the market. Traders should monitor these levels closely, as the market's reaction to them will provide valuable insights into the potential direction of future price action.

EGLD Long SwingNot entering Long yet but this looks pretty Clean.
Will update this after looking in depth into it.
Rejection from this level is going to send this to 47 area.
Planning to long it if holds here.
Wants an entry under 28.
Note:Not a Financial Advise.

EGLDUSDTEGLD ~ 1W ✅
#EGLD Price returns to our buy zone. Make purchases in stages with a minimum target of 20%+

EGLD Price Update & Technical Analysis in a 2-Day TimeframeHello everyone, I’m Cryptorphic.
I’ve been sharing insightful charts and analysis for the past seven years.
Follow me for:
~ Unbiased analyses on trending altcoins.
~ Identifying altcoins with 10x-50x potential.
~ Futures trade setups.
~ Daily updates on Bitcoin and Ethereum.
~ High time frame (HTF) market bottom and top calls.
~ Short-term market movements.
~ Charts supported by critical fundamentals.
Now, let’s dive into this chart analysis:
EGLD failed to break above the 50 EMA resistance and was rejected. The current market price of $28.8 is trying to hold strong, but it will likely weaken if there's insufficient volume.
The invalidation point at $26 is also a support trendline, and a close below this level will likely trigger a drop to the lower support level at $22.4.
For EGLD to turn bullish, it must break the 50 EMA as it did in October 2023.
Key levels:
~ Primary Resistance: 50 EMA.
~ Support: $26.
~ Target: $65 to $75.
~ Adjusted Invalidation Point: A breakdown and close below $22.40.
DYOR, NFA.
Please hit the like button to support my content and share your thoughts in the comment section. Feel free to request any chart analysis you’d like to see!
Thank you!
#PEACE

EGLD falling wedge (against BTC and USD)_EGLD is inching closer towards its potential falling wedge breakout. This chart is to be used in confluence with the EGLD/BTC pairing, see below:
Target here is around 135 USD. EGLD/BTC at 0.0018, and EGLD at 135, would mean BTC is at 75k, which is totally plausible over the next months, taking in to consideration the FED rate cuts coming in September.
