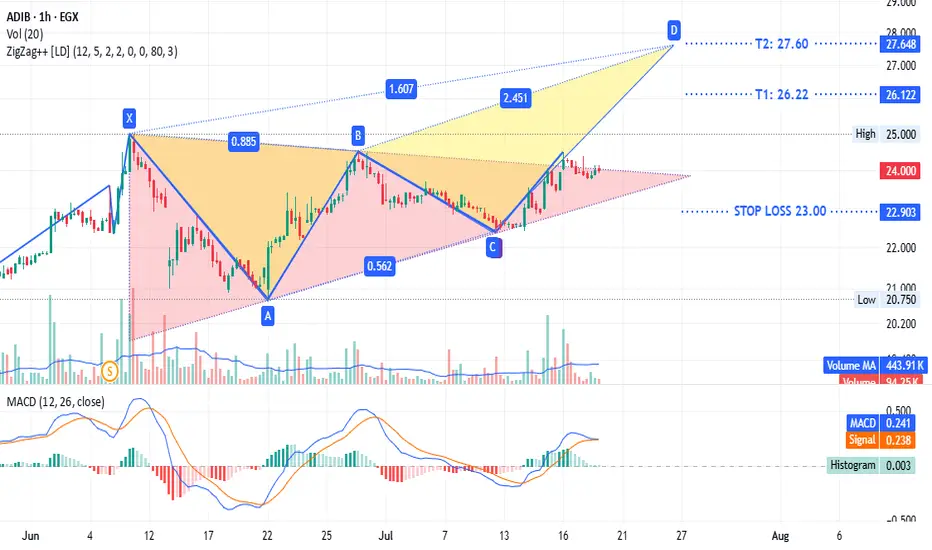
ADIB - same $comi patternADX:ADIB timeframe 1 hour
Is showing a triangle pattern with a potential bearish trend. It is currently testing the upper line of the triangle. The stop loss is at 23.00, and the target sell point ranges from 26.22 to 27.60.
This is not investment advice, only my analysis based on the chart data.
7.507 EGP
9.01 B EGP
40.25 B EGP
510.34 M
About ABU DHABI ISLAMIC BANK- EGYPT
Sector
Industry
CEO
Mohamed Mahmoud Mohamed Aly
Website
Headquarters
Cairo
Founded
1980
ISIN
EGS60111C019
FIGI
BBG000HCW5G0
Abu Dhabi Islamic Bank-Egypt engages in the provision of top-tier online, mobile, and telephonic banking services ensuring clients seamless digital access to their accounts around the clock. The firm is also involved in delivering a comprehensive suite of financial services to clients catering to the needs of individuals, corporations, and affluent customers. The company was founded on June 1, 1980 and is headquartered in Cairo, Egypt.
Related stocks
Ascending Triangle Pattern bullish continuation pattern
**Trend Analysis**
1. **Ascending Triangle Pattern:**
- The chart shows an **ascending triangle** pattern, characterized by a horizontal resistance line and an upward-sloping trendline.
- This is typically a **bullish continuation pattern**, meaning a breakout above resistance could lead t

Visitied the Bullish Order Blocktoday is critical day to confirm ending of correction
details are in the video

ADIB broke-out600 points hike in interest corridor + strong P&L are the key drivers for the break-out

Mystery shopper @14:10 changed the ending50% of the trading volume was @14:10 .. This is THE happy ending & game changer.
detailed MTF analysis.
I am already investing in ADIB, and is my first choice.
I am biased toward ADIB, and have great confidence in his management & BoD.

Catch me, if you can ...ADIB on the run
Targeting 50EGP, 52 EGP consecutively
POSITIVE outlook based on Ichimoku technique on all timeframes (5min-1Day)

trendless minor correction in the short-term
still positive outlook .. mid-term & long-term uptrending
can increase position size by buying @FVG levels.

Weekly outlookThe demonstrated concept is based on FVG, Order Block, and Ichimoku Kinko Hyo. The narrative is in Arabic, and channeled toward Arabic speaking trader in CASE.
Disclaimer: this is not an investment proposal; if you want to invest consult your investment/wealth manager.

ADIB Abu Dhabi to target 46 after crossing 39 (blue line)ADX:ADIB
ADIB (ADX ), on the 1-hour chart, is seen as trying to cross the resistance line (blue) at 39, then the target will be 46.
EITHER Buy here, and stop loss is 37.6
OR Buy after crossing the blue line at 39, and Stop Loss at 38.8
Another scenario is going to test the support (red line) at

buy Adib at 14.42 this is technical analysis for medium Range on weekly chart
buy at 14.42
target 17.55
stop loss 12.02

See all ideas
Summarizing what the indicators are suggesting.
Neutral
SellBuy
Strong sellStrong buy
Strong sellSellNeutralBuyStrong buy
Neutral
SellBuy
Strong sellStrong buy
Strong sellSellNeutralBuyStrong buy
Neutral
SellBuy
Strong sellStrong buy
Strong sellSellNeutralBuyStrong buy
An aggregate view of professional's ratings.
Neutral
SellBuy
Strong sellStrong buy
Strong sellSellNeutralBuyStrong buy
Neutral
SellBuy
Strong sellStrong buy
Strong sellSellNeutralBuyStrong buy
Neutral
SellBuy
Strong sellStrong buy
Strong sellSellNeutralBuyStrong buy
Displays a symbol's price movements over previous years to identify recurring trends.
Frequently Asked Questions
The current price of ADIB is 23.850 EGP — it has decreased by −3.39% in the past 24 hours. Watch ABU DHABI ISLAMIC BANK- EGYPT stock price performance more closely on the chart.
Depending on the exchange, the stock ticker may vary. For instance, on EGX exchange ABU DHABI ISLAMIC BANK- EGYPT stocks are traded under the ticker ADIB.
ADIB stock has fallen by −2.33% compared to the previous week, the month change is a −3.95% fall, over the last year ABU DHABI ISLAMIC BANK- EGYPT has showed a 25.16% increase.
We've gathered analysts' opinions on ABU DHABI ISLAMIC BANK- EGYPT future price: according to them, ADIB price has a max estimate of 41.20 EGP and a min estimate of 41.20 EGP. Watch ADIB chart and read a more detailed ABU DHABI ISLAMIC BANK- EGYPT stock forecast: see what analysts think of ABU DHABI ISLAMIC BANK- EGYPT and suggest that you do with its stocks.
ADIB reached its all-time high on Jun 11, 2025 with the price of 25.000 EGP, and its all-time low was 0.859 EGP and was reached on May 25, 2006. View more price dynamics on ADIB chart.
See other stocks reaching their highest and lowest prices.
See other stocks reaching their highest and lowest prices.
ADIB stock is 3.25% volatile and has beta coefficient of 1.02. Track ABU DHABI ISLAMIC BANK- EGYPT stock price on the chart and check out the list of the most volatile stocks — is ABU DHABI ISLAMIC BANK- EGYPT there?
Today ABU DHABI ISLAMIC BANK- EGYPT has the market capitalization of 27.72 B, it has increased by 6.22% over the last week.
Yes, you can track ABU DHABI ISLAMIC BANK- EGYPT financials in yearly and quarterly reports right on TradingView.
ADIB net income for the last quarter is 2.21 B EGP, while the quarter before that showed 2.23 B EGP of net income which accounts for −0.92% change. Track more ABU DHABI ISLAMIC BANK- EGYPT financial stats to get the full picture.
No, ADIB doesn't pay any dividends to its shareholders. But don't worry, we've prepared a list of high-dividend stocks for you.
As of Aug 1, 2025, the company has 2.49 K employees. See our rating of the largest employees — is ABU DHABI ISLAMIC BANK- EGYPT on this list?
Like other stocks, ADIB shares are traded on stock exchanges, e.g. Nasdaq, Nyse, Euronext, and the easiest way to buy them is through an online stock broker. To do this, you need to open an account and follow a broker's procedures, then start trading. You can trade ABU DHABI ISLAMIC BANK- EGYPT stock right from TradingView charts — choose your broker and connect to your account.
Investing in stocks requires a comprehensive research: you should carefully study all the available data, e.g. company's financials, related news, and its technical analysis. So ABU DHABI ISLAMIC BANK- EGYPT technincal analysis shows the strong buy rating today, and its 1 week rating is buy. Since market conditions are prone to changes, it's worth looking a bit further into the future — according to the 1 month rating ABU DHABI ISLAMIC BANK- EGYPT stock shows the buy signal. See more of ABU DHABI ISLAMIC BANK- EGYPT technicals for a more comprehensive analysis.
If you're still not sure, try looking for inspiration in our curated watchlists.
If you're still not sure, try looking for inspiration in our curated watchlists.