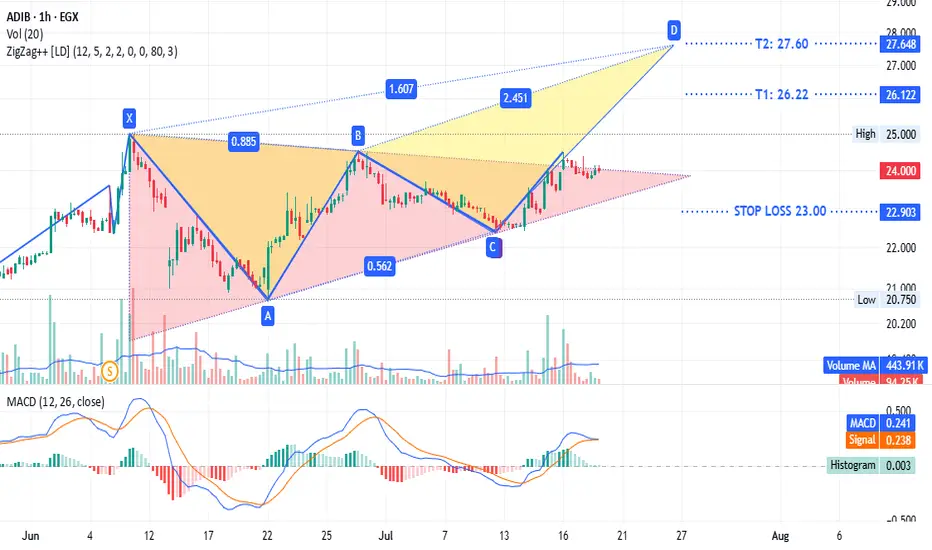
ADIB - same $comi patternADX:ADIB timeframe 1 hour
Is showing a triangle pattern with a potential bearish trend. It is currently testing the upper line of the triangle. The stop loss is at 23.00, and the target sell point ranges from 26.22 to 27.60.
This is not investment advice, only my analysis based on the chart data. Consult your account manager before making any investment decisions. Good luck.
ADIB trade ideas
Ascending Triangle Pattern bullish continuation pattern
**Trend Analysis**
1. **Ascending Triangle Pattern:**
- The chart shows an **ascending triangle** pattern, characterized by a horizontal resistance line and an upward-sloping trendline.
- This is typically a **bullish continuation pattern**, meaning a breakout above resistance could lead to further upward movement.
2. **Support & Resistance Levels:**
- **Resistance:** Around **56.13 EGP** (historical peak).
- **Support:** The **ascending trendline** acts as dynamic support.
- **Major Supports:** **42.57, 41.07, 40.81 EGP** (previous lows and moving averages).
3. **Moving Averages:**
- The price is trading **above key moving averages (blue and red lines)**, suggesting the trend is still bullish.
- These MAs are also acting as dynamic support.
### **Indicators & Momentum**
1. **Volume & Breakout Potential:**
- The volume bars indicate **higher interest** near the breakout level.
- A **strong breakout with high volume** would confirm the pattern.
2. **RSI (Relative Strength Index):**
- Currently around **55-61**, indicating the stock is in a neutral to slightly bullish zone.
- No overbought or oversold conditions.
3. **MACD (Moving Average Convergence Divergence):**
- The MACD line is crossing above the signal line, which is a **bullish signal**.
- A strong crossover with an increase in momentum could confirm an uptrend.
### **Potential Future Movements**
1. **Bullish Scenario:**
- If the price **breaks above 56.13 EGP with strong volume**, the next target could be around **66.66 EGP**.
- This aligns with the measured move of the ascending triangle breakout.
2. **Bearish Scenario:**
- If the price fails to break resistance and falls below the trendline (**around 42-43 EGP**), it may **decline towards 39.88-36.24 EGP**.
### **Conclusion & Trade Idea**
- **Bullish bias** as long as price remains above the trendline.
- Watch for a breakout above **56.13 EGP** for confirmation.
- If price **fails and drops below 36 EGP**, expect a downside move.

Visitied the Bullish Order Blocktoday is critical day to confirm ending of correction
details are in the video

ADIB broke-out600 points hike in interest corridor + strong P&L are the key drivers for the break-out

Mystery shopper @14:10 changed the ending50% of the trading volume was @14:10 .. This is THE happy ending & game changer.
detailed MTF analysis.
I am already investing in ADIB, and is my first choice.
I am biased toward ADIB, and have great confidence in his management & BoD.

Catch me, if you can ...ADIB on the run
Targeting 50EGP, 52 EGP consecutively
POSITIVE outlook based on Ichimoku technique on all timeframes (5min-1Day)

trendless minor correction in the short-term
still positive outlook .. mid-term & long-term uptrending
can increase position size by buying @FVG levels.

Weekly outlookThe demonstrated concept is based on FVG, Order Block, and Ichimoku Kinko Hyo. The narrative is in Arabic, and channeled toward Arabic speaking trader in CASE.
Disclaimer: this is not an investment proposal; if you want to invest consult your investment/wealth manager.

ADIB Abu Dhabi to target 46 after crossing 39 (blue line)ADX:ADIB
ADIB (ADX ), on the 1-hour chart, is seen as trying to cross the resistance line (blue) at 39, then the target will be 46.
EITHER Buy here, and stop loss is 37.6
OR Buy after crossing the blue line at 39, and Stop Loss at 38.8
Another scenario is going to test the support (red line) at 35.5, then it is a buy opportunity to go up to 39.5 (blue).
Stop Loss is 35.4
Either ways, it is a nice trading opportunity.

buy Adib at 14.42 this is technical analysis for medium Range on weekly chart
buy at 14.42
target 17.55
stop loss 12.02

BEWARE ON STRONG RESISTANCE PULLBACK - ADIB - 30 MN - IDEAThank you for your likes and shares! Much appreciated!
__________________________________________________
Abu Dhabi Islamic Bank sees a range forming after a long fall. Very little chance of rapid recovery.
ADIB have strong probability to come and test the red strong resistance line.
Beware on pullback down on that line.
If the market breaks the resistance, there is a strong probability of profitable long direction profitable trade.
Wait for the market to break its actual range before any entry and follow the trend after nice candlestick showing break of ADIB actual very narrow range.
