ADRI - Egyptian stock market - good for medium term investing #ADRI timeframe 1 DAY
Created Gartley Bullish pattern.
Entry level at 1.08 ( price now 1.07)
Stop loss 1.02 ( loss may go to up -5.50% ) - support 1.05
First target at 1.24 ( with profit around 14.49% ) resistance 1.15
Second target 1.37 ( with profit around 26.60% ) resistance 1.28
Third target 1.
About ARAB DEVELOPMENT & REAL ESTATE INVESTMENT
Sector
Industry
Website
Headquarters
Banha
Founded
2011
ISIN
EGS65AN1C018
FIGI
BBG0073F2Q07
Arab Development & Real Estate Investment Co. engages in real estate investment and development activities. Its activities include the sale, purchase, division, and preparation of land; and the development, construction, sale and lease of residential, commercial, and administrative buildings. The company also involves in real estate marketing; general, integrated, and specialized contracting; and general trade and distribution. Its projects include Shebin El Kanater Mall, The Nile Pearl 1, The Nile Pearl 2, and The Nile Pearl 3. The company was founded on February 8, 2011 and is headquartered in Banha, Egypt.
Related stocks

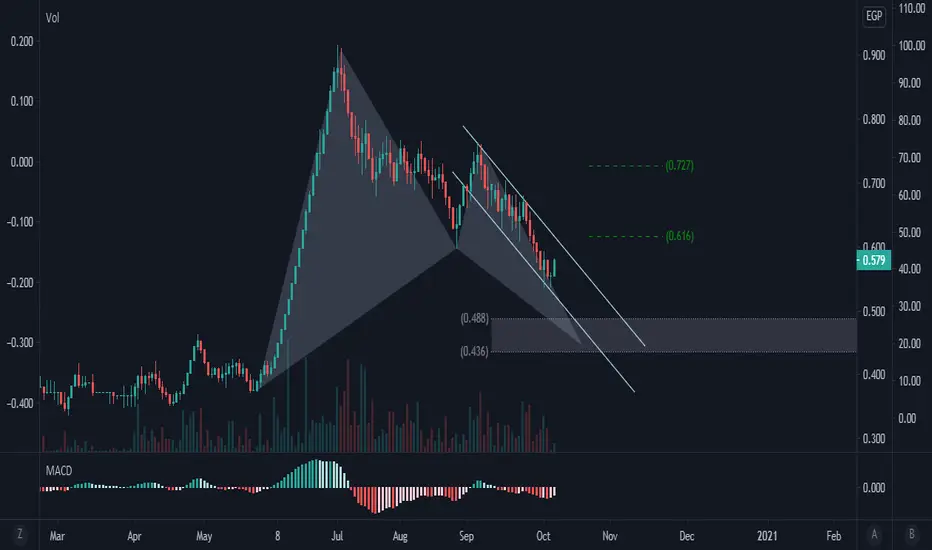
#ADRI Egyptian stock#ADRI time frame 1 HOUR
created a bullish Gartley pattern
entry level at 1.10
stop loss 1.05
first target at 1.20
second target 1.25 up to 1.30
NOTE : this data according to time frame 1 HOUR
Its not an advice for investing only my vision according to the data on chart
Please consult your account

ADRI - Arab Development & Real EstateEntry 0.774 or 0.769
Stop Loss 0.765
This a reaction for EGX30 recent rejections

See all ideas
Summarizing what the indicators are suggesting.
Oscillators
Neutral
SellBuy
Strong sellStrong buy
Strong sellSellNeutralBuyStrong buy
Oscillators
Neutral
SellBuy
Strong sellStrong buy
Strong sellSellNeutralBuyStrong buy
Summary
Neutral
SellBuy
Strong sellStrong buy
Strong sellSellNeutralBuyStrong buy
Summary
Neutral
SellBuy
Strong sellStrong buy
Strong sellSellNeutralBuyStrong buy
Summary
Neutral
SellBuy
Strong sellStrong buy
Strong sellSellNeutralBuyStrong buy
Moving Averages
Neutral
SellBuy
Strong sellStrong buy
Strong sellSellNeutralBuyStrong buy
Moving Averages
Neutral
SellBuy
Strong sellStrong buy
Strong sellSellNeutralBuyStrong buy
Displays a symbol's price movements over previous years to identify recurring trends.
Frequently Asked Questions
The current price of ADRI is 1.840 EGP — it has increased by 8.88% in the past 24 hours. Watch ARAB DEVELOPMENT & REAL ESTATE INVESTMENT stock price performance more closely on the chart.
Depending on the exchange, the stock ticker may vary. For instance, on EGX exchange ARAB DEVELOPMENT & REAL ESTATE INVESTMENT stocks are traded under the ticker ADRI.
ADRI stock has risen by 69.59% compared to the previous week, the month change is a 91.07% rise, over the last year ARAB DEVELOPMENT & REAL ESTATE INVESTMENT has showed a 84.00% increase.
ADRI reached its all-time high on Mar 26, 2015 with the price of 2.727 EGP, and its all-time low was 0.232 EGP and was reached on Sep 26, 2019. View more price dynamics on ADRI chart.
See other stocks reaching their highest and lowest prices.
See other stocks reaching their highest and lowest prices.
No, ADRI doesn't pay any dividends to its shareholders. But don't worry, we've prepared a list of high-dividend stocks for you.
Like other stocks, ADRI shares are traded on stock exchanges, e.g. Nasdaq, Nyse, Euronext, and the easiest way to buy them is through an online stock broker. To do this, you need to open an account and follow a broker's procedures, then start trading. You can trade ARAB DEVELOPMENT & REAL ESTATE INVESTMENT stock right from TradingView charts — choose your broker and connect to your account.
Investing in stocks requires a comprehensive research: you should carefully study all the available data, e.g. company's financials, related news, and its technical analysis. So ARAB DEVELOPMENT & REAL ESTATE INVESTMENT technincal analysis shows the strong buy rating today, and its 1 week rating is strong buy. Since market conditions are prone to changes, it's worth looking a bit further into the future — according to the 1 month rating ARAB DEVELOPMENT & REAL ESTATE INVESTMENT stock shows the strong buy signal. See more of ARAB DEVELOPMENT & REAL ESTATE INVESTMENT technicals for a more comprehensive analysis.
If you're still not sure, try looking for inspiration in our curated watchlists.
If you're still not sure, try looking for inspiration in our curated watchlists.