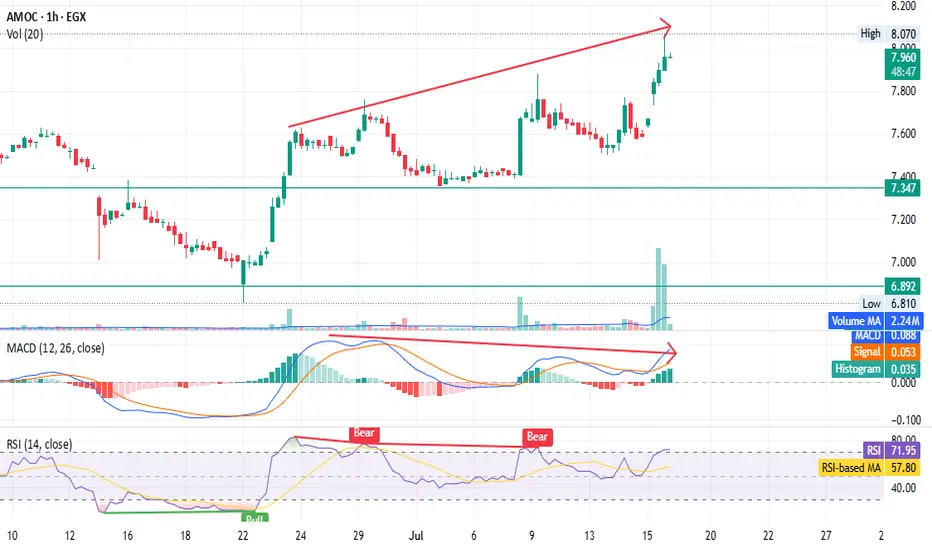
AMOC - Beware of the bear trap - only for shareholders EGX:AMOC timeframe: 1 hour
Prices continue to rise, forming a higher top than the previous one,
but MACD shows a negative divergence.
RSI indicates bearish dominance despite the price increase.
High volume with a gap, unsupported by other indicators, suggests possible distribution.
Stop loss (profit-saving) at 7.62.
This is not financial advice, just our analysis based on chart data. Consult your account manager before investing.
Thanks and good luck!
AMOC trade ideas
Breakthrough significant downtrend resistance line - EMA200 AMOC has successfully penetrated significant downtrend resistance line and EMA200 supported by volume exceeding average 30 days vol, targeting the bellow level:
- Potential buy range: 7.8 - 7.9
- TP1: 8.7
- TP2: 9.8
- SL: below 7.5

AMOC Long If the price holds the 0.618, then we are seeing a new ath. Highly good play in here.
Just be aware that there is a resistance @ 11.7 to 12.7. Take some profits at this level and move your SL to breakeven.

AMOC long update The stock was in a strong downtrend, but it seems to be reversing to the upside.
On the bright side, or the bullish side, the price has started making higher highs and higher lows, which could be a good sign if we consider this recent downtrend a pullback within a larger uptrend.
On the bearish side, this is a very risky trade, as bears could put pressure on the price and drive it lower to sweep the liquidity below 6.4 EGP. Also, I haven't been following the news lately, but it seems there was some negative news that drove most Egyptian stocks lower. I’m not exactly sure what the news was or how long its impact will last.
To sum it up, if you have the patience, wait for the stock to reach 6.1 to 6.3 EGP before going long. Otherwise, you can enter long now, but keep your stop-loss tight, as identified.
DYOR and read the news to understand what caused the stock market to decline and what the expectations are for the general financial situation in the coming period.

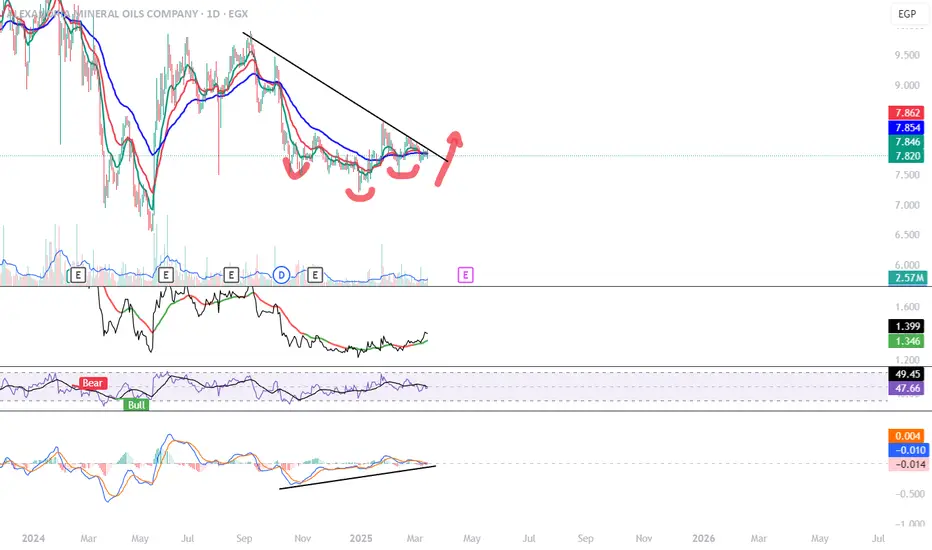
AMOC (Alexandria Mineral Oils Company) – Bullish Breakout Ahead?
**📈 AMOC (Alexandria Mineral Oils Company) – Bullish Breakout Ahead? 🚀**
🔎 **Technical Analysis (1D Chart):**
AMOC has been trading in a long-term downtrend but is now showing signs of a potential reversal. The price action has formed what appears to be an **inverse head and shoulders pattern**, which is a strong bullish reversal signal when confirmed with a breakout.
- **Inverse Head and Shoulders:** The formation is visible with three distinct lows, suggesting a possible trend reversal.
- **Descending Trendline Resistance:** The stock has been respecting a major downward trendline. A breakout above this level could lead to a strong upside move.
- **Moving Averages:** The price is hovering around the short-term moving averages. A bullish crossover between the moving averages could act as further confirmation of upward momentum.
- **MACD Bullish Divergence:** The MACD indicator is showing a rising trend while the price has been forming lower lows, indicating weakening bearish momentum and potential bullish strength.
- **RSI Near Key Levels:** The RSI is moving around neutral levels, suggesting that the stock has room to rally if buyers step in.
🔑 **Key Levels to Watch:**
- **Immediate Resistance:** **7.85 - 7.86 EGP** (needs to break for confirmation)
- **Support Levels:** **6.97 EGP** (holding above this is crucial)
- **Breakout Target:** **9+ EGP** (based on the pattern projection)
📊 **Market Sentiment:**
Volume has started to pick up, which is a positive sign, but a clear breakout above resistance is needed to confirm a sustained move higher. If buyers step in with strong volume, AMOC could see a trend reversal and a push towards higher price levels.
⚠️ **Risk Management & Disclaimer:**
This is **NOT financial advice**. Always conduct your own research and apply proper risk management before making any trading decisions. Markets are unpredictable, and technical patterns are not guaranteed to play out as expected. Stay cautious and trade responsibly!
🔥 **What’s Next?**
A daily close above the resistance level could signal the beginning of a new bullish trend. If the stock fails to break out, it may consolidate or retest support before attempting another move. Keep an eye on volume and confirmation signals before entering any trade.
📢 **What do you think? Will AMOC break out soon? Share your thoughts below!** 👇
#AMOC #EGX #Trading #Breakout #TechnicalAnalysis #StockMarket #Investing
#AMOC Egyptian stock #EGX30 According to below chart there is gartly pattern at time frame 1 hour
entry level from 7.71 to 7.77
stop loss 7.70 ( closing 1 hour )
target 1 = 7.85
target 2 = 8.00
may the prices go down to 7.65 and 7.59 then going up to achieve the below targets that's according to anther pattern but on time frame 15m
closing under 7.65 may go to 7.12
note : this data according to time frame 1 hour
note : EGX30 is negative
Its not an advice for investing only my vision according to the data on chart
Please consult your account manager before investing
Thanks and good luck

There's no guarantee your mom won't get that far. Are There ?I had the idea of what it is to ensure that the price does not fall to the level of daily and weekly imbalance of the price shown in the chart. Just an idea
It seems logical and likely not now, but possible in the near future.
It is honest to offer this idea to you for caution and precaution.
Despite the issuance of quarterly business results, which are very positive and increase profits from the corresponding period last year, but in the Egyptian Stock Exchange it is better to brainstorm all possibilities.
The price zone of 7.5 to 6.8 appears to be without support on the chart.
Leave the answer to actual and future trading.
Theoretical advice for all buyers to monitor the movement of the stock during the rest of the week so that it goes away and climbs to a safe area to buy... Buying now is a risk that only you can take.
In God's favor.

AMOC Egypt has a good trading opportunity to 8.9AMOC Egypt has a good trDaily chart
The stock EGX:AMOC is trading in a channel between lines R and S, so the opportunity to buy near support S and sell near resistance line R (at around 8.9)
Technical indicators RSI and MACD are supporting the bullish view.
Closing above 9.0 for 3 days, the target will be 10.5
Closing above 10.9 for 2 weeks, the target will be 12
Below line S is considered a stop loss level, as the next down target will be 6.0
Note : Always keep a profit protection level, and raise it as the price goes up.ading opportunity to 8.9

AMOC Egypt has a good trading opportunity to 8.9Daily chart
The stock EGX:AMOC is trading in a channel between lines R and S, so the opportunity to buy near support S and sell near resistance line R (at around 8.9)
Technical indicators RSI and MACD are supporting the bullish view.
Closing above 9.0 for 3 days, the target will be 10.5
Closing above 10.9 for 2 weeks, the target will be 12
Below line S is considered a stop loss level, as the next down target will be 6.0
Note : Always keep a profit protection level, and raise it as the price goes up.

Comprehensive Technical Analysis and Outlook for AMOC Stock
The AMOC stock chart presents a detailed technical analysis using various indicators and overlays. At the top, the Volume Price Trend (VPT) indicator highlights cumulative volume adjusted for price changes, indicating significant buying and selling pressures through its peaks and troughs. The Efforts vs. Results indicator below shows the relationship between volume and price movements, where oscillations and crossovers can signal potential trend reversals or continuations.
The main price chart, which uses Heikin Ashi candles, shows a slight decline to 9.138 EGP (-0.55%). The chart also includes a Moving Average (MA9) to identify short-term trends, and volume is displayed at the bottom to gauge trading activity. The stock has experienced fluctuations, with notable upward movements but currently facing resistance around the 9.2 EGP level.
Key levels of support and resistance can be inferred from the chart’s price actions and volume. The stock has been in a consolidation phase, with the price oscillating between support at approximately 8.5 EGP and resistance around 9.2 EGP. The recent price movements suggest a potential continuation of this range unless a breakout occurs.
Detailed Analysis
1. Volume Price Trend (VPT):
• The VPT indicator shows significant buying and selling pressures. Peaks in the VPT correspond to strong buying activity, while troughs indicate selling pressures.
• Currently, the VPT is relatively stable, suggesting a balance between buyers and sellers.
2. Efforts vs. Results:
• This indicator highlights the relationship between volume and price movements. Oscillations and crossovers can signal changes in market sentiment.
• The recent oscillations suggest uncertainty, with no clear trend dominance.
3. Heikin Ashi Candles:
• These candles provide a smoothed representation of price movements, filtering out market noise.
• The recent candles show a mixed sentiment with small-bodied candles, indicating indecision among traders.
4. Moving Average (MA9):
• The MA9 provides insight into short-term trends.
• The stock is currently fluctuating around the MA9, indicating a lack of strong short-term momentum.
5. Support and Resistance Levels:
• The stock is facing resistance at 9.2 EGP. If it breaks this level with increased volume, it could signal a bullish trend.
• Support is around 8.5 EGP. If the stock falls below this level, it could signal a bearish trend.
Outlook for Tomorrow
For tomorrow’s trading session, the immediate outlook for AMOC stock suggests caution. The stock is at a critical resistance level of 9.2 EGP. If it breaks above this level with increased trading volume, it could signal the start of a more substantial upward move. However, if it fails to break this level and instead moves downward, it may retest the support level around 8.5 EGP.
Recommendation for Investors Holding from 9.5 EGP
Investors who bought AMOC at around 9.5 EGP are currently at a slight loss. Here are some recommendations:
• Short-Term Strategy: If the stock breaks above 9.2 EGP with strong volume, consider holding as it might signal further gains. Set a stop-loss just below the 9.0 EGP level to minimize potential losses.
• Long-Term Strategy: If you believe in the long-term potential of AMOC, consider holding the stock. Monitor key support levels, especially around 8.5 EGP. If the stock falls below this level, consider selling to limit further losses.
• Risk Management: Use stop-loss orders to protect your investment. A stop-loss just below the 8.5 EGP support level can help limit losses if the stock continues to decline.
Overall, closely monitoring the volume and price action, as well as market news and sentiment, will be crucial for making informed decisions.

AMOC may test 4.4 Weekly chart, the stock is likely forming a broadening pattern.
The price may test the lower support line at 4.50 - 4.40
Trading in this situation is not recommended as this pattern indicates uncertainty of the longer term direction..

Steady Grind on AMOC- My entry area is marked in green
- Trendline resistance @ 13.50 area
- Breakout of this trendline can send it to 14.80 area.
- Watch out 'cause AMOC likes to do liquidity grab, so give it space to move.

AMOC wait till it tests the main resistance at 10.17I don't recommend buying until it gives a better sign, or testing 10.17 if it crosses down, will test the demand zone with a range of 9-9.4

AMOC to target 14.4 after crossing resistanceDaily chart, AMOC is trading in a descending channel, and it seems a chart pattern will be formed - a flag / inside a triangle.
After crossing the resistance (at 10.35 - 10.4), the target will be 12 and 12.6 , then some correction may happen at 12.6 before reaching the target 14.4
Stop loss below 9.6 to be considered.

AMOC, has positive signs of up movement, to target 11AMOC, EGX,
On daily chart, the support level is building up at 8 - 8.15
Crossing the upper channel line at 8.6 will push the stock to higher targets, 9.2, 10, 11

AMOC is building support, to target 10.61 in 2-3 daysAMOC , on the 1-hour chart, is showing signals to move away up from the support level of 10 - 10.02 and the target will be 10.61 in 2 - 3 days.
Stop loss at 10.0 should be considered.

AMOC to target 13.95 soonAMOC is preparing to cross up 11 - 11.1, then the target will be 13.95 - 14
There are technical indicators including RSI; to support this view.
Note: Stop loss level 10.6 (closing below for 60 minutes)

you can buy amoc between 4.13 - 4.07this is technical analysis for short term on hourly chart
buy at 4.07
target 4.47
stop loss 3.90

AMOC 2023/06/18AMOC didn't break the support line at 8.0 LE I am expecting it to reach up to resistance line 10.5 LE if it breaks the 8.0 LE support line you have to get it back at the second support line at 6.5 LE.

AMOCEGX:AMOC
One of the best stocks in Egyptian Market, Good opportunity to buy at current levels 7.6 - 7.8
It has to be watched closely till it closes above 8 EGP, once done it should fly high.
Else, close the trade asap and wait a bit more for good entry.
Good Luck

Amoc Long TermSchiff Pitchfork
The Schiff Pitchfork is a drawing tool used in technical analysis that is derived from the standard pitchfork. There are three basic components of a standard pitchfork. There is a center median line (trend line) as well as two more sets of lines above and below that median line. The additional lines are set a specified number of standard deviations away from the median. Where the Schiff Pitchfork differs is that its origin's location is modified from a standard pitchfork. The Schiff Pitchfork's origin is located at 1/2 the vertical distance and 1/2 the horizontal distance between the high and low points (first two points set).
A Schiff pitchfork (just like a standard pitchfork) is created by first drawing a trend line between two extreme points. A third point is then set either above or below the second point depending on the analyst's desired Schiff Pitchfork location. Keep in mind that the default Schiff Pitchfork setting calls for two additional sets of lines to be drawn. Tradingview allows for up to 9 sets of lines to be added. If additional lines are added, the user can save this setup as a template for later use.
The basic idea behind the use of a Schiff Pitchfork and a standard pitchfork is that it essentially creates a type of trend channel. A trend is considered active as long as price stays within the Schiff Pitchfork channel. Reversals occur when price breaks out of a Schiff Pitchfork channel.

NEXT MARKET MOVE UP TO 2023NEXT MARKET MOVE UP TO 2023
At the bold black line, a major area,
At the orange line, a sub area
WE CAN UPDATE AFTER BROKEN

