EFIH breakthrough significant horizontal resistanceEFIH is moving in an upward channel supporting its medium - long term positive performance.
Currently EFIH breakthrough a significant horizontal resistance level at 13.37 supporting it's positive performance in the short term, potential targets and stop loss level is as follows:
- Potential buy rang
0.451 EGP
1.60 B EGP
5.21 B EGP
879.09 M
About E-FINANCE FOR DIGITAL AND FINANCIAL INVESTMENTS
Sector
Industry
CEO
Ibrahim Ali Sarhan
Website
Headquarters
Giza
Founded
2005
ISIN
EGS743O1C013
FIGI
BBG012S18JF5
e-Finance for Digital & Financial Investments SAE engages in the development of digital payments infrastructures. It offers management, operation, and maintenance of all devices, equipment and computer networks; managing and operating applications for providing banking services through the phone and the internet, electronic payment services, and electronic circulation of temporary documents. The company was founded on August 26, 2005 and is headquartered in Giza, Egypt.
Related stocks

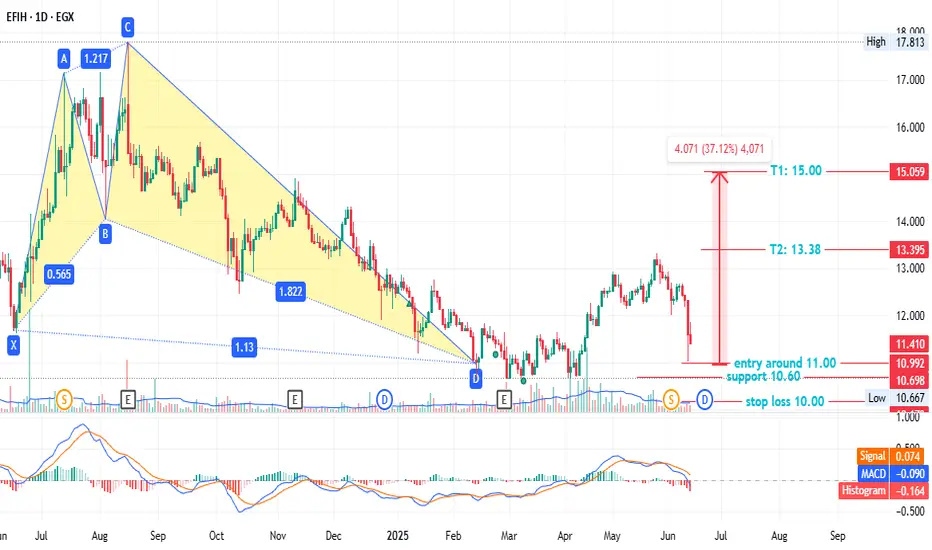
EFIH - anther chance - low risk EGX:EFIH - 1-Day Timeframe
A bullish pattern emerged on Feb 13, but prices adjusted after the 3/2 stock split on Jun 02. Key levels:
- Entry: ~11.00
- Stop loss: 10.00 (7.00% loss)
- Support: 10.60 (6-month low)
- Targets:
- T1: 13.38 (22.24% profit)
- T2: 15.00 (37.12% profit)
E-Finance Breakout: Trendline Breach Signals Fresh Upside PotentE-Finance (EGX) has just broken out of a descending trendline on the weekly chart, supported by momentum indicators turning bullish. The Ichimoku cloud shows that the price is attempting to re-enter bullish territory. With the MACD turning positive and the Squeeze Momentum shifting green, this break

#EFIH Egyptian stock#EFIH time frame 1 DAY
Created Gartley Bullish pattern ,
Entry level at 18.65 to 18.45
Stop loss 17.45 ( estimated loss - 7.20% )
First target at 20.66 ( estimated profit 10% )
Second target 22.50 ( estimated profit 21% )
Third target 24 ( with profit 28% )
MACD show positive diversion that is

EFIH-LONGe-finance for Digital and Financial Investments S.A.E. (EGX:EFIH)
Technical Overview
• Current Price (April 3, 2025): 16.95 EGP/share
• 100-Week Range: 13.25 – 27 EGP/share
• Below EMA 200: Bearish sign; technically under long-term resistance
• Gann Analysis TP: ~32.11 EGP in Dec 2025 (based on( 2+(

E-Finance for Digital and Financial Investments (EGX) - PotentiaHere’s a trading idea you can publish on TradingView based on the image:
---
**E-Finance for Digital and Financial Investments (EGX) - Potential Reversal Setup**
📉 **Technical Analysis:**
The stock has been in a strong downtrend, forming a falling wedge pattern, which is typically a bullish r

long _ fundamental investorYour latest update provides some positive catalysts for EFIH:
Strong Earnings Growth:
Net income for 9M 2024: 1.39495B EGP, which is 3.5% of market cap
+21% Y-o-Y growth → Indicates strong business expansion
Strategic Partnership with Visa:
Focus on digital payments, merchant solutions, and finan

EFIH BEARISH Daily & Hourly timeframe
#traders4traders
***This video is educational, and is not an investment proposal.
Disclaimer:
The content provided is for Educational purposes only. It should not be interpreted as legal, tax, investment, financial, or any other form of advice. Investing in stocks carries inherent risks and may

EFIH bearish on weekly timeframeMajor FVG must be visited @ 18-19 EGP.
The bearish signal is confirmed by the cessation of the recent uptrend and indicators like MACD and REDK Everex turning bearish.
#traders4traders
***This video is educational, and is not an investment proposal.
Disclaimer:
The content provided is for Educat

EFIH rejeuvinationBullish
outlook based on VWAP, MACD, Stochastic, RSI, Elliot waves, & Ichimoku on different timeframes suggests BUY
Short term target around 27
for further analysis, watch the video

See all ideas
Summarizing what the indicators are suggesting.
Oscillators
Neutral
SellBuy
Strong sellStrong buy
Strong sellSellNeutralBuyStrong buy
Oscillators
Neutral
SellBuy
Strong sellStrong buy
Strong sellSellNeutralBuyStrong buy
Summary
Neutral
SellBuy
Strong sellStrong buy
Strong sellSellNeutralBuyStrong buy
Summary
Neutral
SellBuy
Strong sellStrong buy
Strong sellSellNeutralBuyStrong buy
Summary
Neutral
SellBuy
Strong sellStrong buy
Strong sellSellNeutralBuyStrong buy
Moving Averages
Neutral
SellBuy
Strong sellStrong buy
Strong sellSellNeutralBuyStrong buy
Moving Averages
Neutral
SellBuy
Strong sellStrong buy
Strong sellSellNeutralBuyStrong buy
Displays a symbol's price movements over previous years to identify recurring trends.
Curated watchlists where EFIH is featured.

Frequently Asked Questions
The current price of EFIH is 13.820 EGP — it has increased by 6.31% in the past 24 hours. Watch E-FINANCE FOR DIGITAL AND FINANCIAL INVESTMENTS stock price performance more closely on the chart.
Depending on the exchange, the stock ticker may vary. For instance, on EGX exchange E-FINANCE FOR DIGITAL AND FINANCIAL INVESTMENTS stocks are traded under the ticker EFIH.
EFIH stock has risen by 16.13% compared to the previous week, the month change is a 9.60% rise, over the last year E-FINANCE FOR DIGITAL AND FINANCIAL INVESTMENTS has showed a −9.91% decrease.
EFIH reached its all-time high on Mar 12, 2024 with the price of 18.123 EGP, and its all-time low was 4.971 EGP and was reached on Oct 19, 2021. View more price dynamics on EFIH chart.
See other stocks reaching their highest and lowest prices.
See other stocks reaching their highest and lowest prices.
EFIH stock is 8.02% volatile and has beta coefficient of 1.36. Track E-FINANCE FOR DIGITAL AND FINANCIAL INVESTMENTS stock price on the chart and check out the list of the most volatile stocks — is E-FINANCE FOR DIGITAL AND FINANCIAL INVESTMENTS there?
Today E-FINANCE FOR DIGITAL AND FINANCIAL INVESTMENTS has the market capitalization of 45.07 B, it has decreased by −3.27% over the last week.
Yes, you can track E-FINANCE FOR DIGITAL AND FINANCIAL INVESTMENTS financials in yearly and quarterly reports right on TradingView.
EFIH net income for the last quarter is 434.39 M EGP, while the quarter before that showed 604.60 M EGP of net income which accounts for −28.15% change. Track more E-FINANCE FOR DIGITAL AND FINANCIAL INVESTMENTS financial stats to get the full picture.
E-FINANCE FOR DIGITAL AND FINANCIAL INVESTMENTS dividend yield was 1.97% in 2024, and payout ratio reached 52.12%. The year before the numbers were 2.09% and 59.65% correspondingly. See high-dividend stocks and find more opportunities for your portfolio.
As of Aug 8, 2025, the company has 1.15 K employees. See our rating of the largest employees — is E-FINANCE FOR DIGITAL AND FINANCIAL INVESTMENTS on this list?
EBITDA measures a company's operating performance, its growth signifies an improvement in the efficiency of a company. E-FINANCE FOR DIGITAL AND FINANCIAL INVESTMENTS EBITDA is 2.10 B EGP, and current EBITDA margin is 40.17%. See more stats in E-FINANCE FOR DIGITAL AND FINANCIAL INVESTMENTS financial statements.
Like other stocks, EFIH shares are traded on stock exchanges, e.g. Nasdaq, Nyse, Euronext, and the easiest way to buy them is through an online stock broker. To do this, you need to open an account and follow a broker's procedures, then start trading. You can trade E-FINANCE FOR DIGITAL AND FINANCIAL INVESTMENTS stock right from TradingView charts — choose your broker and connect to your account.
Investing in stocks requires a comprehensive research: you should carefully study all the available data, e.g. company's financials, related news, and its technical analysis. So E-FINANCE FOR DIGITAL AND FINANCIAL INVESTMENTS technincal analysis shows the strong buy rating today, and its 1 week rating is strong buy. Since market conditions are prone to changes, it's worth looking a bit further into the future — according to the 1 month rating E-FINANCE FOR DIGITAL AND FINANCIAL INVESTMENTS stock shows the buy signal. See more of E-FINANCE FOR DIGITAL AND FINANCIAL INVESTMENTS technicals for a more comprehensive analysis.
If you're still not sure, try looking for inspiration in our curated watchlists.
If you're still not sure, try looking for inspiration in our curated watchlists.