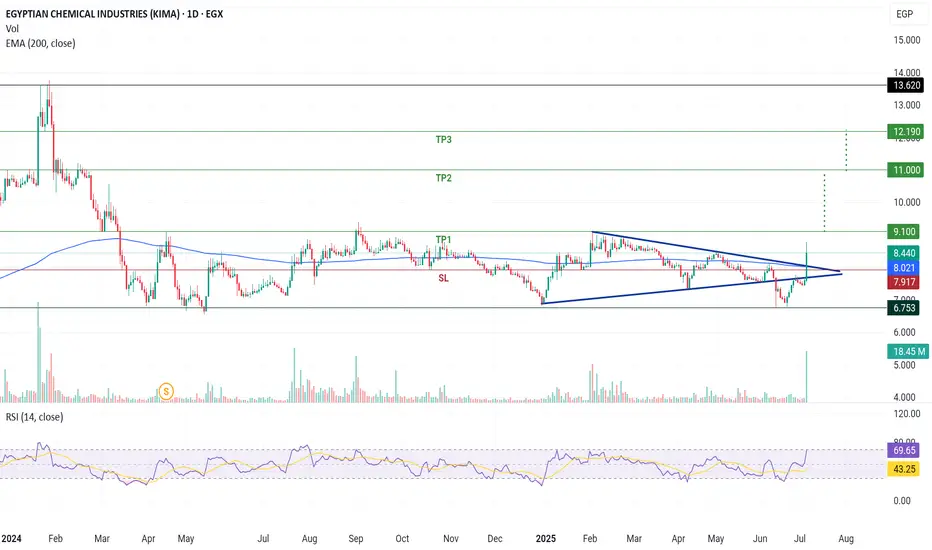
Simitric triangle pattern breakthrough + vol.The stock has been moving sideways since March 2024, and today succeeded to breakthrough a simitric triangle pattern with volume exceeding the past 6 month.
- Potential buy range: 8:8.4
- TP1: 9.1
- TP2: 11
- TP3: 12.2
- SL: Below 7.9
EGCH trade ideas
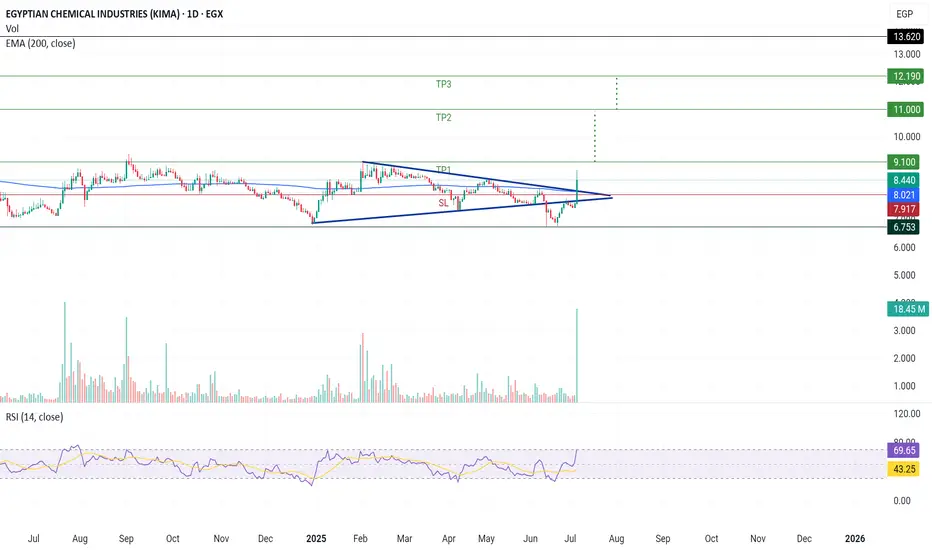
Simitric triangle pattern breakthrough + volThe stock has been moving in sideways since March 2024, and formed a simitric triangle pattern which succeeded to breakthrough today with volume exceeding past 6 month.
- Potential buy range: 8 : 8.30
- TP1: 9.1
- TP2: 11
- TP3: 12.2
- SL: 7.9
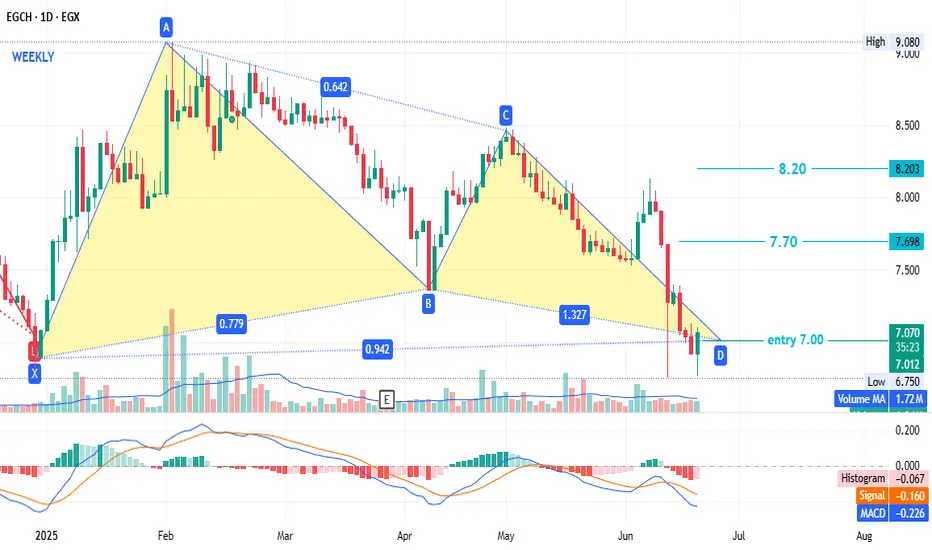
EGCH - old enemy - low riskConsider a long position with the following parameters:
Entry: 7.00
Stop loss: 6.80
Targets: 7.70 (T1), 8.20 (T2)
This is not investment advice but my analysis based on chart data. Consult your account manager before investing. Good luck.
EGCH: Building Momentum – Eyes on the Next Move!“EGCH is setting up for a potential move with strong momentum and a bullish structure. Watching for a key reaction around the 8.40–8.50 EGP zone, where buyers could step in for continuation. If strength holds, upside potential toward 9.20–9.50 EGP is on the table. A breakout above 8.80 EGP with volume would confirm further momentum. Keeping an eye on how price reacts at these levels—let’s see how it plays out! ”

EGCHjust noticed this valid short right now.
I have no information about the stock or the company behind it, also i didnt follow the news today or anything related to this coin. So this is only TA analysis opportunity

EGCH ( what happened ???? ) What's Happening with Kima Stock (EGCH) on the Egyptian Exchange
Kima stock is one of the constituents of the EGX70 index on the Egyptian Exchange.
Phase One (August to September 2024):
The EGX70 index rose from 6200 points in August 2024 to 7028 in September 2024, a 13.35% increase. Similarly, Kima stock rose from 7.46 to 8.41 during the same period, also by 13.35%. So far, everything seems aligned, with no discrepancies between the main index and the stock.
However,
MACD had a different opinion.
Despite the main index and Kima stock forming an upward trend (higher lows and higher highs) during this period, the MACD indicator for Kima stock formed a downward trend (lower highs and lower lows), despite the rising prices.
Phase Two (September 17 to October 14):
The main index rose by about 6% to 7350 points, forming a higher high than the September 4 peak at 7250, thus confirming the upward trend, and establishing a strong support zone between 7350 and 7250.
Note: The main index formed a higher high than the previous peak.
On the contrary, Kima stock declined by 5.50% to 8.06 on October 13 and fell by more than 11% from its price of 9 Egyptian pounds on September 4.
Here, we find a head and shoulders pattern targeting the price range of 7.2 to 7.
Of course, the first positive sign is the daily close above the right shoulder at 8.73.
Phase Three (October 14 to November 24):
The main EGX70 index continues to rise and reach new highs, reaching 8350 from 7350, representing a 14% increase, breaking new historical highs. Even now, the index is trading around the 8400 level.
As for Kima stock, it rose by about 7% to 8.78 on October 29 from the last low formed on October 14 at 8.06, which is just a test of the right shoulder of the head and shoulders pattern that we mentioned earlier, and which failed to close above.
Today, November 24, although the main index is still trading at its highest levels, Kima stock has lost all its gains during the previous period and has broken the neckline of the head and shoulders pattern, targeting the 7.20 to 7 range, and is expected to continue falling.
Conclusion:
What happened here is exactly what the great writer Larry Williams mentioned in his famous book "Secret of Selecting Stocks" in the second chapter (Methods of Identifying Accumulation and Distribution or Disposal of Stocks).
In short, if a stock does not perform like the index to which it belongs, it is in an accumulation phase (a falling index and a rising or stable stock) or a distribution (disposal) phase (a rising index and a falling stock or a small rise followed by a loss).
Kima (EGCH) is clearly in a professional disposal process from September 2024 until now. I believe this is due to the recent subscription for the stock, which improved the average stock price for major shareholders, thus pushing them to dispose of some of these shares and profit from the subscribed shares.
Note that Kima stock rose by approximately 200% from January 2023 to January 2024, losing about 40% of those gains from the beginning of 2024 until now.

Kima Egypt should target 11Daily chart, the stock EGX:EGCH is preparing to cross the resistance zone 9.1 - 9.2
Trading above 9.2 for 2 days, the target will be 11 then 11.6 passing through a resistance zone at 10
MACD indicator is positive.
Stop loss below 8.8 should be considered.

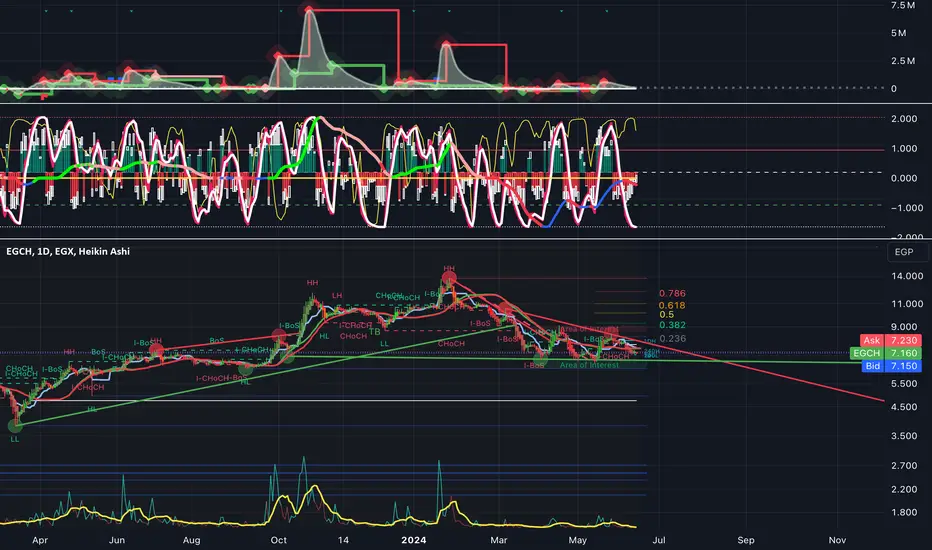
Comprehensive Technical Analysis and Outlook for KIMA StockThe KIMA stock chart presents a comprehensive technical analysis with several indicators and overlays. At the top, the Volume Price Trend (VPT) indicator highlights cumulative volume adjusted for price changes, reflecting significant buying and selling pressures through its peaks and troughs. The Efforts vs. Results indicator below demonstrates the relationship between volume and price movements, where oscillations and crossovers can signal potential reversals or trend continuations.
The main price chart, which uses Heikin Ashi candles, shows a slight increase to 7.158 EGP (+0.42%). It includes a Moving Average (MA9) to identify short-term trends, and volume is shown at the bottom to gauge trading activity. The light line on the price chart represents the Tenkan-sen from the Ichimoku cloud, which provides insight into short-term momentum and trend direction.
The chart also features Fibonacci retracement levels, marking significant support and resistance levels at 0.236, 0.382, 0.5, 0.618, and 0.786. These levels help identify potential areas where the price might reverse or consolidate. Trendlines indicate a persistent downward trend since late 2023, with lower highs confirming the bearish sentiment.
For tomorrow’s outlook, the stock is at a critical juncture near the 7 EGP support level. If this level holds and the volume increases, we could see a potential reversal or bounce-back, especially if it breaks above the 7.5 EGP resistance level. However, if the stock falls below 7 EGP with increased selling volume, further declines could be expected, with the next support level likely around 6.5 EGP.
For investors who bought at 8.5 EGP, the situation is more delicate. If the stock begins to recover and surpasses the 7.5 EGP mark, holding on might be beneficial. However, if the downward trend continues, it would be wise to set stop-loss orders to limit further losses. Monitoring the key Fibonacci levels, trendlines, and volume trends will be crucial for making informed decisions.
KIMA's performance remains mediocreKIMA's performance remains mediocre, struggling to gain traction at the 7.87 level. It's like Deportivo La Coruña during their relegation seasons. Despite having a talented player like Lucas Pérez, who showed great potential and skill, the team struggled significantly and faced relegation from La Liga. Pérez, while a strong individual performer, couldn't turn the tide for the team on his own, illustrating the challenge of a superstar player unable to secure victories for a faltering team
KIMA is like a team in the major league that just can't find its rhythm, akin to one of the worst teams in the Spanish football league, trying to score but failing to dribble past defenders.

Chicago Bulls Chart Play: EGAL's Bullish Setup Echoes 1999 ChampEGAL is in the golden zone, aiming for the 61% Fibonacci retracement, mirroring the EGX70EW. A bullish TK cross could emerge next week. The mid-point of the Bollinger Band rests at the 50% Fibonacci, with the upper band at the 61%. The 50% Fibonacci level is the current hurdle, and volume is diminishing.
We're poised for a rebound by Pippen, setting up a fast break to Jordan for a slam dunk, reminiscent of the Chicago Bulls' fiery championship final game in the 1999 season. Just like then, we're aiming to dominate and clinch the world championship!

EGCH, long uptrend to 11.3 , 15.5EGCH, Egypt
One the weekly chart, a technical pattern flag was formed, and the target is 11.3
Once we cross up this level, the stock should target 15.5
This is a medium term view in few months.
Profit protection should be considered.

EGCH 23/06/18 in Supply ZoneThis stock in the supply zone if it crossed 10 LE can target the historical high

KIMA EGX EGCH ready to flyPositive indications and signs. Very high probability for a nice upwards move. EGX stock EGCH.
Monthly chart is also very supportive for upwards trend.

EGCH, Egypt to target 9.8 in few weeksOn weekly chart,
EGCH (KIMA) is drawing a flag pattern, once crossing up the resistance line, the stock will target 9.80 and more, in few weeks.

EgchGoals on the monthly frame 16 pounds, then 20 pounds, and I remember my words and password in the stock 8.20

Small upswing, then a big downswingThree historical upward waves were created, then two corrective waves are nearing completion, and another large corrective wave is left

NEXT MARKET MOVE UP TO 2023NEXT MARKET MOVE UP TO 2023
At the bold black line, a major area,
At the orange line, a sub area
WE CAN UPDATE AFTER BROKEN

