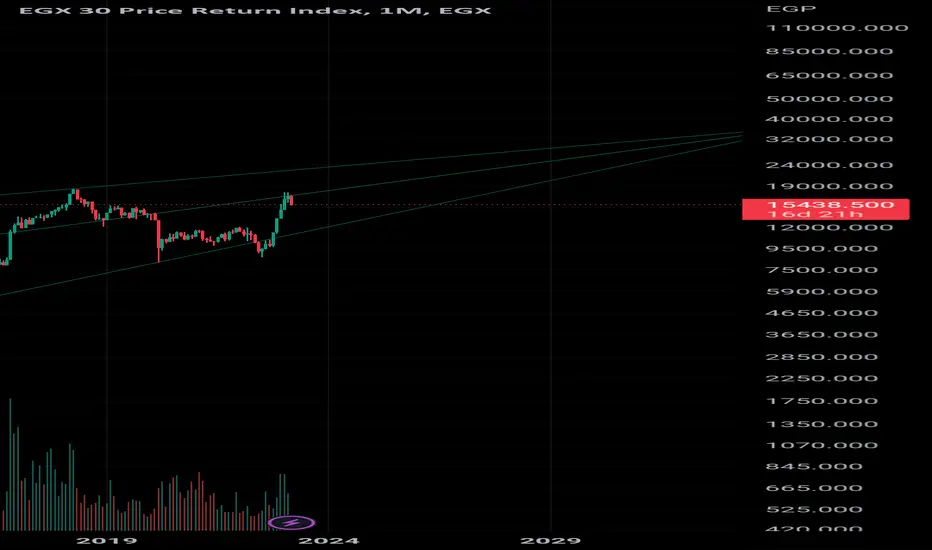
The Final Stretch for EGX30Since my last update, the EGX30 has precisely followed the narrative and wave counts.
Right now we are headed to finalize wave 5 of the impulse. In the light of the escalating geopolitical tensions and the 2024 elections taking place in December 2023, there is a possibility for wave 5 to be much shorter than anticipated.
Personally, I hope we break the 21000 EGP level first where I am taking profit on all my positions, but I am considering a soft stop loss around 17K and a hard stop loss at 15K.
EGX30 trade ideas


expected correction after big move EGX30 Good reduction of EGX30 indicator and expected correction areas of the chart

egx30The Egyptian Stock Exchange has not risen since its summit in 2008. A real motive rise has returned.. only a corrective sideways rise, and it must drop strongly in the shaded area in order to end all weakness and gather itself to make a strong motive rise like what happened between 2002 to 2008
Please clarify that I am helping you with my point of view, which may be right or wrong, and see my previous analyzes of many currencies and forex in order to judge the owner of this analysis with a more accurate look
Good luck

THE NEXT BULL MARKET MIGHT BE THE NEXT BULL market up to 2023 ,2024
also devaluation gives Egyptian stock indices a lot of positive


Cyclical Characteristics of Market Performance IndicatorsFrom Technical Analysis in the Vicinity of Financial Physics
The buying strength shown by ISTRI decreased with a rate higher than the decrease of buying pressure and buying momentum. This explains the reason for future decline in buying pressure, momentum.
PS the momentum indicator is the product of volume and the change in price.

EGX30last Thursday, EGX30 witnessed a buying pressure after testing the support that lies at 17750 point, which increases the importance of that support. The major resistance lies at 18143 point, which is the level that the EGX30 needs to break it to above, to confirm the continuation of the major uptrend on medium term basis, which will trigger a new buying signal with targets near to 18415 - 20000 - 21075 point on short term basis.
the vision will still positive towards the EGX30, and that's based on the positivity of the technical indicators, and there is improvement in the performance of some of leading stocks, which increases the possibility of achieving the positive scenario and break the mentioned major resistance.
Thus, we recommend to step in only if the 18145 is broken upwards, with a stop loss under 17295 point.

EGX30, on a critical level EGX30 on 30-min chart, is on a support level 16600, and should turn upwards.
Breaking this level down will take the index to 15600 - 15700 level.
However, RSI is positively in the buy region.

Egypt Finacial Market Perspective.After the thirtieth index reached the levels of 9500 points, affected by the successive crises of the repercussions of the Corona virus and the exit of hot money after the beginning of the Federal Reserve interest rate hike. The Egyptian stock market was suffering from severe frustration until the signs of breakthrough appeared from the first of October and November of the year 2022.
A strong recovery phase has begun that shows in the Egyptian financial markets some stability of the international community's confidence in the Egyptian economy, the success of negotiations between those in charge of the state's monetary and financial policies with the IMF and others, and the beginning of financial flows to the Egyptian economy. This pushed the main index of the Egyptian Exchange to reach the level of 17678.453, approaching its highest level since 2018 at 18364.984.
Hence the questions began to revolve around whether it is possible to reach the 19,000 level or is it a distant dream that comes about half a decade ago. The answer lies in the fact that monetary tightening by the Central Bank of Egypt is still in place to contain the price crisis and inflation and the waves of interest rate hikes attract a large fiscal liquidity.
Even with the latest 22% certificates, banks absorbed cash amounting to 162 billion pounds in four days. However, decreasing interest certificates have emerged, which is seen as monetary tightening will calm down a bit and focus on the stability of the pound's exchange rate, which has a major role in the strong decline in inflation, as we witnessed in the second half of 2017.
Hence the dream of the stock exchange in everyone's imagination, as government offerings, stable interest rates, stable exchange rate and the reversal cycle of liquidity may reach the Egyptian stock index to above 20,000 points.
As for the technical analysis of the index - the index has strong support at two points at 15284.215, which is considered central support and above it support for Fibo 23 at 15549.447
Either targeting the 18364.984 point or the occasional movement between the levels of 17678.453 and 15427.629

EGX30 run because of devaluation of the currencyEGX30 will break the previous resistance at 17750 and the historical resistance at 18400 in 2018 because of the repeated devaluations of the currency against the USD

EGX30 rally because of the devaluation of the currencyEGX30 will break the previous resistance at 17750 and the historical resistance at 18400 in 2018 because of the repeated devaluations of the currency against the USD

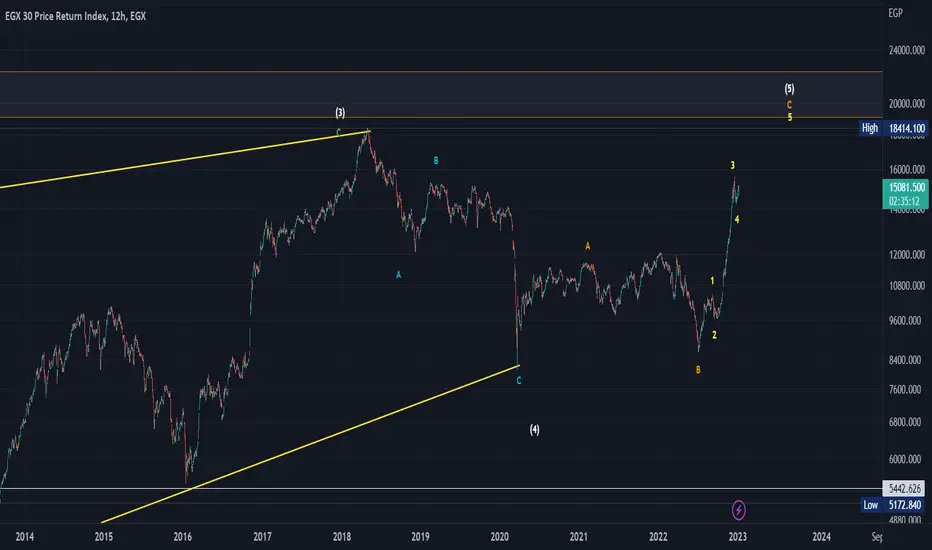
A Painful Q2 for EGX?We had quite an impulsive run on EGX30 since summer 2022 with more than 105% gain however, nothing lasts forever :(
We're due for a correction!!
In the light of my elliot wave count, we should anticipate wave 4 to correct anywhere between 11 - 30%. I personally expect a 24% correction to meet the golden ratio (0.618 feb) for the retracement, with an invalidation below 12700.
Generally, wave 4 is where everyone gets frustrated and we can easily see this happening with the current overall sentiment in Egypt hitting seriously low levels while inflation skyrockets and fears of further devaluation of the EGP builds up.
This won't last long however. If my forecasts were correct, we should be over by May or June, and those who kept their patience and built positions during the correction will profit without a doubt.
Let's see where we will go :)

Egx 30 Egx 30 long term trade after breaking and retest the upper trend we will see new high targets of Egx 30 index .
EGX30The end of the corrective rise of the Egyptian Stock Exchange is approaching, and it is expected to have a final collapse of wave completion areas C


EGX30 to 6173 🔻🔻🔻 SELL NOW 📉According to my analysis to EGX30. I see that its about to collapse more than 60% and its targeting 6173.
My analysis depends on :
Supply and Demand
Fibonacci
Idea fails after making a new HIGH
NOT A FINANCIAL ADVICE

EGXThere remains the rise of a final and final impulse wave, and thus the EGX indicator will be making historical bullish waves and making a leading Digonol pattern.
EGX30 | BRICS RoadMapEgypt Joins the BRICS New Development Bank
the NDB finances infrastructure and sustainable development projects in areas such as energy, transportation, water, communications, and health.
"Since 2016, the Bank has invested in multiple projects, including US$7.2 billion in India alone," RT reported, recalling that Egypt expressed an interest in becoming an NDB member in July.
"BRICS is working to develop its own financial infrastructure, including a joint payment network, with some member states having already switched to trade in local currencies in order to reduce dependence on the U.S. dollar and euro," it added.
Currently, Egyptian President Al Sissi is in Saudi Arabia participating in the summit of Arab countries with China, the nation with the largest economy among the BRICS.
Egyptian Finance Minister Mohamed Maait affirmed his country's enthusiasm for enhancing cooperation with international development partners, especially in light of the "unprecedented development movement" he is witnessing in Cairo.
Previously, the Chinese Foreign Affairs Ministry has noted that Argentina, Algeria, Iran, Indonesia, Turkey and Saudi Arabia are also interested in joining the BRICS bloc.

Another analysis EGX30The current ascent continues and breaks the last historical peak by a slight difference, from which the drainage begins, thus completing Five waves the internal waves of the Ending Diagonal shape

egx30 full classic map full classic mapping for egx30 , historical angled trend lines for support and resistance

EGX30 weeklyBreaking the level of 10280 up will activate targets and resistance to test the level of 12000, as for breaking the level of 9770 down, it will activate targets down to the level of 8100 or to test the main trend line of the index 30

EGX30 and a small recoveryEGX30 recovery begin, and will face a three retracement resistance at 9414.735, 9899.130, and 10297.455
