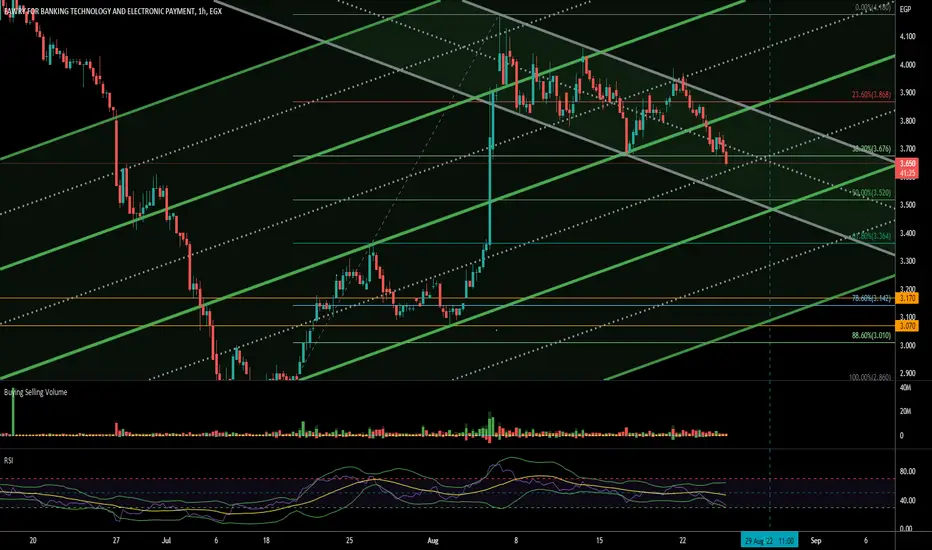
Fawry short position I love Fawry stock since it has been doing well during bad times in the Egyptian market. Its really an undervalued stock that i expect it to do exceptionally well in the future. However, based on the chart (for short term) for this stock to really takes off, it need to correct, grap liquidity and to the moon from there. So i think, realistically, its has to go down in the short term to later face the its ath resistance.
so i have checked the possible scenarios for the short positions and hopefully iam right. As for now this is only TA, and i havent checked the fundamentals so iam not really sure.
for anyone who is willing to take this trade, please, check the fundamentals , and the economic conditions. always DYOR.
FWRY trade ideas

FWRYanalysis performed using the following strategies and indicators:
Ichimoku Kinko Hyo
Law of diminishing returns
Volume price trend
Relative Strength Index (RSI)
Average True Range (ATR)
Linear Regression

FWRY: warrior rest ahead of the next level ... 8EGP BreakoutFWRY: warrior rest ahead of the next level ... 8EGP Breakout
the closing of the day was the best part of the trading session.
positive sentiments that will lead to crossing the order block; confirmed by chikou span.

there is an opportunity for trading next week, let's pass ....The demonstrated concept is based on FVG, Order Block, and Ichimoku Kinko Hyo. The narrative is in Arabic, and channeled toward Arabic speaking trader in CASE.
Disclaimer: this is not an investment proposal; if you want to invest consult your investment/wealth manager.

FAWRY, Egypt, is on a critical price level !Daily chart, the stock is trading in a rising channel, and is inclined to test the support line (Red), then rebound to the resistance line (blue)
Below support, the target is 4.62.
Above the support, the target is 7.76 (Crossing at around 6.66 - 6.70)


FWRYThe stock is still positive, and another entry point is the latency, two candles on the daily timeframe above 5.91. It will be another buying point, to target from the 6.85 region

Weekly Analysis FWRYFWRY seems to be in the range part during the last 2 days, it needs to stay above 4.95 to be able to go to 5.138 then to 5.38
If you want to learn more about technical analysis and be able to analyse the market conditions, subscribe to my blog link in bio it has alot of tips and tricks about the market

Bullish FWRYAs you have seen the last 2 days, buying power has the hold now . This can be concluded from the 2 engulfing patterns for the last 2D sessions.

Possible Recovery FWRYThis has been a rough week, but their is hope next week to see a possible recovery in the market. The market dojii candle means that buying power is back and may introduce a reversal pattern in the new couple days. Next week will be risky.

FwrySupport Levels
3.67 3.5 3.36
stop today Close below 3.67 for 2 Daily Candles
Fib Levels
Probable Parallel Channels
Gap at 3.17 :@
Bullish (FWRY)THIS IS NOT AN INVESTING ADVICE, I AM ONLY SHARING MY THOUGHTS, AND WOULD LOVE TO HEAR YOURS
As you can see a BOS has occurred which indicates a bullish movement, so as long as the price stays above 6.299 this will ensure bullish.

Ascending Triangle PatternAs you can see the the graph forms an ascending triangle pattern and it has now stabilized above the last support of 6.65.
If it continues to go down the second support will be over 6.589. However an ascending triangle may imply bullish so if it continue to stabilize over the 6.589 this is a possible bullish up to the 1st resistance @ 6.85 and 2nd resistance @ 7.25

NEXT MARKET MOVE UP TO 2023NEXT MARKET MOVE UP TO 2023
At the bold black line, a major area,
At the orange line, a sub area
WE CAN UPDATE AFTER BROKEN


Fawry long termFawry is trading inside down channel we have to break the resistance to become bullish again

Fwry Pitch Fork
The technical indicator known as Andrews Pitchfork is not that well known and is rarely used by novice traders. However, it is a quick and easy way for traders to identify possible levels of support and resistance for an asset's price. It is created by placing three points at the end of previous trends and then drawing a line from the first point that runs through the midpoint of the other two points. The reason this indicator is called a "pitchfork" becomes apparent from the shape that is created in the chart.
Fib Channel
The Fibonacci channel is a technical analysis tool that is used to estimate support and resistance levels based on the Fibonacci numbers. It is a variation of the Fibonacci retracement tool, except with the channel the lines run diagonally rather than horizontally.
Mixing Both and having some Trends to let the price walks on...
At the end ....
Dance With me.
Best Regards.

Time closes to invest in fawry I think we will se dump to fawry share to the end the channel at 5.49 the will be great dip cause it meets 0.618 fib extension to the wave a in the bigger c and 0.618 to the major wave in this correction
Targets
26
33
41

fawRY divergence ..BUY BETWEEN 12 TO 13.5fawRY divergence ..BUY BETWEEN 12 TO 13.5
buy fawry between 12 to 13.5
target : 16
stoploss : 12


Trade technical Plan for FWRY stock This is my view on the trade plan for FWRY stock.
the stock is in a strong uptrend and it shows strong potential to continue this strong uptrend.

Idea to buy in FWRYA Thought of a buy trade
Support shows a good opportunity to buy
SL/TP based on previous point
