Heli shortThis stock needs to be shorted ASA it reaches the red zone. Once it reaches there short this stock and place your targets above this red area.
DYOR before you take the trade. As i have no information about the company nor what it even does other than its name which looks like a housing or realstate brokers company of some sort.
HELI trade ideas

HELI .. the renaissance of Rocking StarHELI is on the RUN. Immediate Targets are 10.84 & 11 EGP.
This video is educational, and not an investment proposal.
Disclaimer:
The content provided is for informational purposes only. It should not be interpreted as legal, tax, investment, financial, or any other form of advice. Investing in stocks carries inherent risks and may lead to potential losses, including the loss of principal. It's important for investors to recognize that past performance does not guarantee future returns, and market fluctuations can impact investment value. Stocks discussed here are not synonymous with, nor should they be seen as a replacement for time deposits or similar saving instruments. Investing in securities of smaller companies may involve higher risks compared to larger, more established firms, possibly resulting in substantial capital losses.
Ichimokuonthenile.

HeliJinny Gann Fan Levels are on the Chart possible Trendlines my WAY.
Jinny Gann Fan/Horizontal Lines Works as Support / Resistance.
Important levels for the Big Cycle on the chart.
Trade Wisely.

Positive outlook crossing the Red KUMOIntraday Target 11.20, 11.30, 11.40 EGP
Equilibrium Point is the recommended purchase price

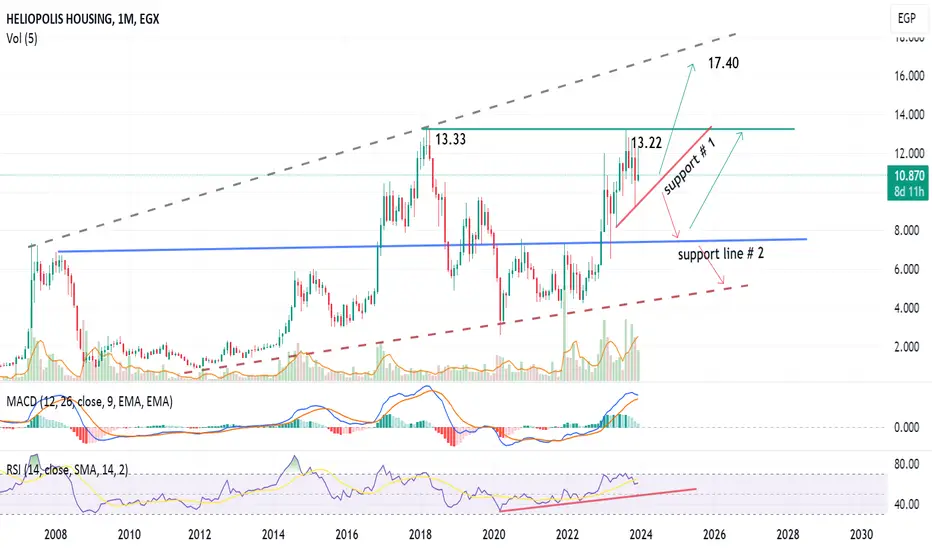
Which scenario will Heliopolis Housing (HELI) choose?Monthly chart, Heliopolis Housing (HELI) stock seems to have 2 scenarios.
Either to cross 13.22 - 13.33 up and target 17.4 - 17.5
Or to break support # 1 down to support # 2
The indicators RSI is still positive, MACD is signalling a tendency for correction.
Note: this is long term trading map..
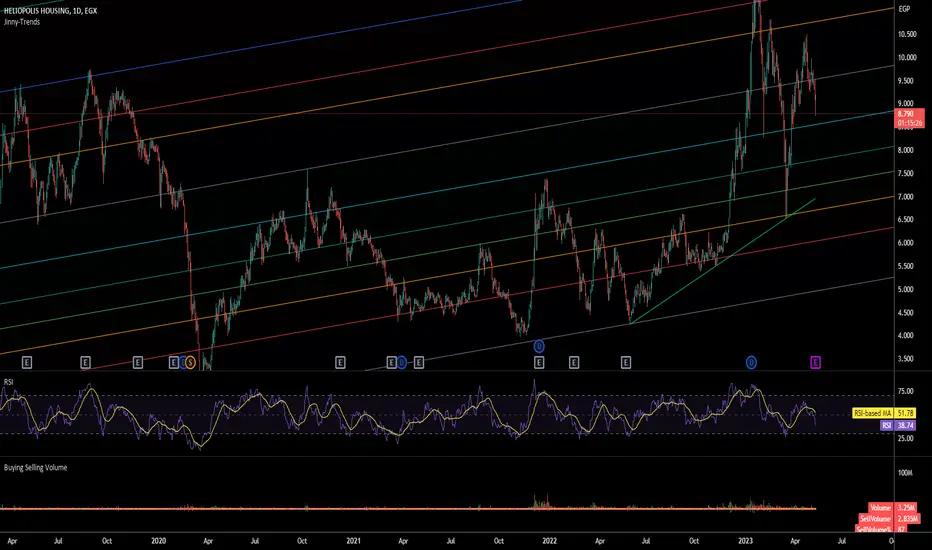
Heli Daily Fib ChannelLong Term Trends
Trade between these levels.
<>
The Fibonacci Channel is a technical analysis tool that is used to estimate support and resistance levels based on the Fibonacci numbers. It is a variation of the Fibonacci retracement tool, except with the channel the lines run diagonally rather than horizontally.
The tool is used to aid in identifying where support and resistance may develop in the future. If the uptrend is expected to continue, the 100%, 161.8%, and other higher levels are potential price targets. The same concept applies to downtrends if a downtrend is expected to continue
In an uptrend, the zero-line is like a normal trendline, helping to assess the overall trend direction. If the price falls below it, it may need to be adjusted based on more recent price action, or it could signal that the uptrend is over and that the price is breaking lower. Similarly in a downtrend, the zero-line also acts like a trendline. When the price is below it, it helps confirm the downtrend. If the price moves above it, the indicator may need to be redrawn or the price is moving higher out of its downtrend
Difference Between Fibonacci Channels and Andrew's Pitchfork
Both these indicators attempt to predict future support and resistance levels based on price levels from the past. Fibonacci channels attempt to do this with percentages of a selected price move. Those percentages are then projected out into the future. Andrew's Pitchfork is simpler in some ways as the angled lines are based on three price levels selected the trader and then extended out into the future.
HELI EGX has potential for higher highsHELI is getting some minor correction in the weekly uptrend.
Higher good targets are foreseen within 4 - 6 weeks
10, 10.5, 11, ..
