Cup and Handle** pattern with a breakout.
- The **cup** formation represents a rounded bottom, indicating a period of consolidation and accumulation.
- The **handle** represents a minor pullback or sideways movement before a potential breakout.
In this case, the breakout seems to have occurred, as indicated by the sharp upward movement following the handle. The target price is likely projected based on the depth of the cup, which is typically added to the breakout level.
The chart suggests a **Cup and Handle** pattern with a breakout. Based on standard technical analysis, the price target is typically measured by adding the depth of the cup to the breakout level.
From the chart:
- **Cup depth** (approximate) = ~3.2 EGP (from ~3.1 to ~6.3 EGP)
- **Breakout level** = ~6.3 EGP
- **Target** = **6.3 + 3.2 = ~9.5 EGP**
### Key Levels:
- **Entry**: Around 5.5 - 6.3 EGP (breakout confirmation)
- **Stop-loss**: Below ~5.0 EGP (previous resistance turned support)
- **First target**: ~7.5 EGP (psychological resistance)
- **Final target**: ~9.5 EGP
If volume remains strong and market sentiment is bullish, the price could reach the full target. However, always watch for pullbacks and retests.
ISMQ trade ideas

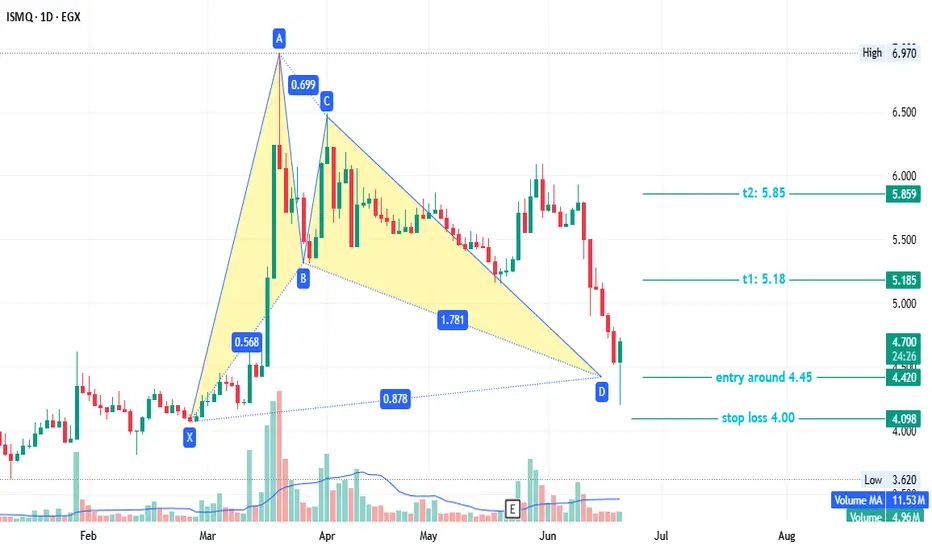
ISMQ - interested EGX:ISMQ timeframe 1 day
Created Bullish Gartley pattern, so we can see action price in this point .
Entry level around 4.45
Stop loss 4.00
First target at 5.18
Second target 5.85
NOTE : this data according to timeframe 1 day.
Its not an advice for investing only my vision according to the data on chart
Please consult your account manager before investing
Thanks and good luck
ISMQ - great fundamental #ISMQ timeframe 1 HOUR
created Gartley Bullish pattern, so we can see action price in this point .
Entry level around 5.44
Stop loss 5.30 ( loss may go to up -2.50% )
First target at 5.76 ( with profit around 6.00% )
Second target 6.04 ( with profit around 11.13% )
Third target 6.24 ( with profit around 14.87% )
NOTE : this data according to time frame I hour,
Its not an advice for investing only my vision according to the data on chart
Please consult your account manager before investing
Thanks and good luck

#ISMQ#ISMQ created a bullish Gartley pattern at time frame 30m
entry level around 4.22
stop loss 4.19
first target at 4.35
second target 4.42 up to 4.48
NOTE : this data according to time frame 30m
note : MACD and RSI show positive diversion may support our idea
also may prices go down to 4.15 then it will active anther Gartley pattern at time frame 1 hour and then the stop loss will be 4.10 ( targets still the same )
Its not an advice for investing only my vision according to the data on chart
Please consult your account manager before investing
Thanks and good luck

iron is black goldstand in 4.58
t1 .... 4.87
t2 .... 5
st 4.58 with close
support 4.16 ///4.14
volume is less

Iron and Steel for mines and quarries: : A Promising Opportunity
The stock exhibits several promising signals:
-Relative Strength Index crosses 50
Moving Average Convergence Divergence crosses signal line
Volume above Moving Average, except last day,
over the 200-day Moving Average
Touched the resistance level of 2.811 twice, forming a double bottom
Factors to monitor:
last day correction, it may test the 61.8% level at a stock price of 3
The stock price is at resistance, of the 50-day Moving Average
It will encounter very strong resistance at 3.41

ISMQ is forming a triangle pattern..30-min chart, ISMQ is trading in a triangle, where the price is in the midway and the direction is downwards to the support line S.30
We should have a direction confirmation before a new buy entry.
Crossing above R.30, will push the price to 5.25
Stop loss below 4.60

ISMQ is near a critical zone!1-hour chart, the stock is near the support line S, and should rebound to the Resistance line R (around 5.0)
Below support line, it can fall down to 4.13 then 3.75, 3.5 and 3.35
Be careful!
Stop loss below 4.48

ISMQ, Egypt, is on a critical price level !30-min chart,
I chose this "little" time-frame to see intra-day sentiments. This is not for opening new positions. Be careful!
Higher probability for testing the support (red) line, then rebound upwards; as the technical indicator Stochastic RSI is 0, and the volume is decreasing with price decrease.
After crossing the resistance (blue) line, the target will be 4.33
But below support, it is 2.37

Potential trade on ISMQstuck in a range for couple of months.
already its in a good area to start adding shares imo.

ISMQ to rebound from 1.52 - Target 1.581-hour chart, ISMQ should re-test the support line (red) at 1.52, then rebound to 1.58
After crossing up the resistance line (blue), the target will be 1.66
Stop loss at 1.52


NEXT MARKET MOVE UP TO 2023NEXT MARKET MOVE UP TO 2023
At the bold black line, a major area,
At the orange line, a sub area
WE CAN UPDATE AFTER BROKEN

