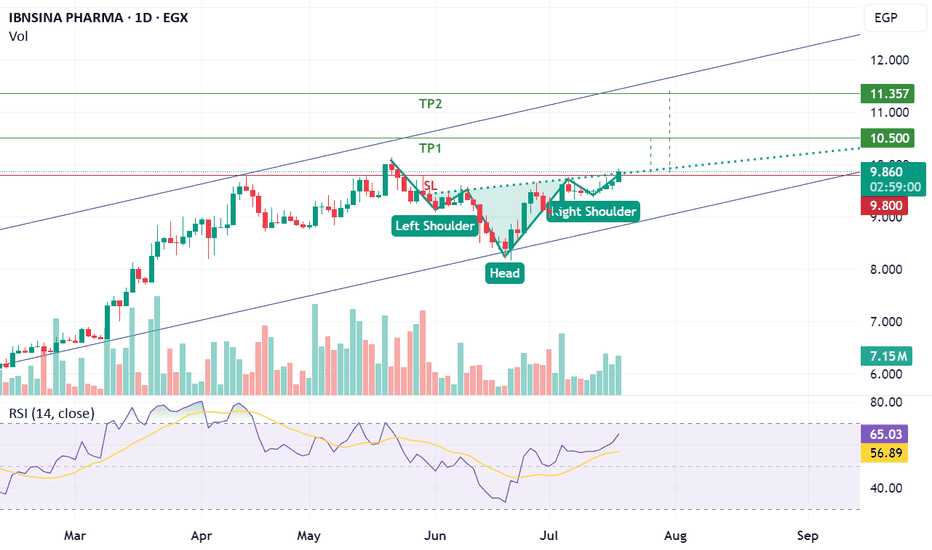
Inverted head and sholder patternISPH just breakthrough a significant resistance line which is considered inverted head and shoulders resistance line, if the price closed higher than 9.8 this will result in achieving the below targets.
- Potential buy range: 9.75 - 9.83
- TP1: 10.5
- TP2: 11.3
- SL: below 9.7 "require confirmation"
ISPH trade ideas
ISPH Short I think there is a valid short opportunity here.
Here is more fundamental analysis (done by ChatGPT).
///////////////////////////////////////////////////////////////////////////////
Ibnsina Pharma is a prominent pharmaceutical distribution company in Egypt, listed on the Egyptian Exchange under the ticker symbol ISPH. Established in 2001, the company distributes a wide range of pharmaceutical and cosmetic products to both private and public-sector clients, including pharmacies, hospitals, and healthcare institutions.
INVESTING.COM
Financial Overview:
Revenue: In 2023, Ibnsina Pharma reported revenues of approximately EGP 33.95 billion.
BARRONS.COM
Net Income: The net income for the same period was EGP 173.14 million, resulting in a net profit margin of 0.51%.
BARRONS.COM
Total Assets and Liabilities: The company's total assets stood at EGP 18.55 billion, with total liabilities amounting to EGP 17.1 billion, indicating a debt-to-assets ratio of 92.19%.
BARRONS.COM
Shareholder Structure:
Ibnsina Pharma's ownership is diversified among prominent entities:
Free Float: 40.7%
Abdel Gawad Family: 15.0%
Faisal Islamic Bank: 14.0%
Mahgoub Family: 12.9%
European Bank for Reconstruction and Development (EBRD): 9.6%
Blom Investment: 7.8%
This diverse shareholder base has enhanced the company's corporate governance practices.
IR.IBNSINA-PHARMA.COM
Stock Performance:
As of January 29, 2025, the stock closed at EGP 7.02 per share, with a 52-week range between EGP 2.14 and EGP 7.59.
IR.IBNSINA-PHARMA.COM
Considerations for Investors:
While Ibnsina Pharma has demonstrated significant revenue generation, its net profit margin is relatively low, and the company operates with a high debt-to-assets ratio. Potential investors should weigh these factors carefully and consider consulting with a financial advisor to determine if this investment aligns with their risk tolerance and financial objectives.
This week is critical for ISPHThis week is critical for ISPH
Multi timeframe analysis weekly to 5 minutes
Analysis is based on Ichimoku, and Elliot waves. Confirmation is done by other indicators such as MACD, stochastic RSI, OBV, and RedK Everex.
Watch the video idea to have the full picture of the stock under analysis.
watch the video for more details
Disclaimer:
The Content is for informational purposes only, you should not construe any such information or other material as legal, tax, investment, financial, or other advice.
There are risks associated with investing in stocks, and might involve risk of loss. Loss of principal is possible. Investors should note that past performance is not a guarantee of future returns. The investment value may be affected by market fluctuations.
The stocks mentioned here are not equivalent to, nor should it be treated as a substitute for, time deposit or any other form of saving deposits.
Investment in the securities of smaller companies can involve greater risk than is generally associated with investment in larger, more established companies that can result in significant capital losses.
isphThe first target would be the 382 retracement of AD and the second target the 618 retracement of AD. A common stop level would be behind the X-point. Conservative traders may look for additional confirmation. Bat Patterns can be bearish and bullish. TradingView has a smart XABCD Pattern drawing tool that allows users to visually identify 5-point reversal structures on a chart.
ISPH for SHARK 32 loversISPH in Egyptian stock market has amazing chart full of shark 32
The chart show SHARK 32 four times in 20 session based on daily frames.
the first two are combined in 4 bars followed by two single SHARK 32
This is an ideal chart for people that need to learn trading based on SHARK 32
Dr. Tarek Gadallah


