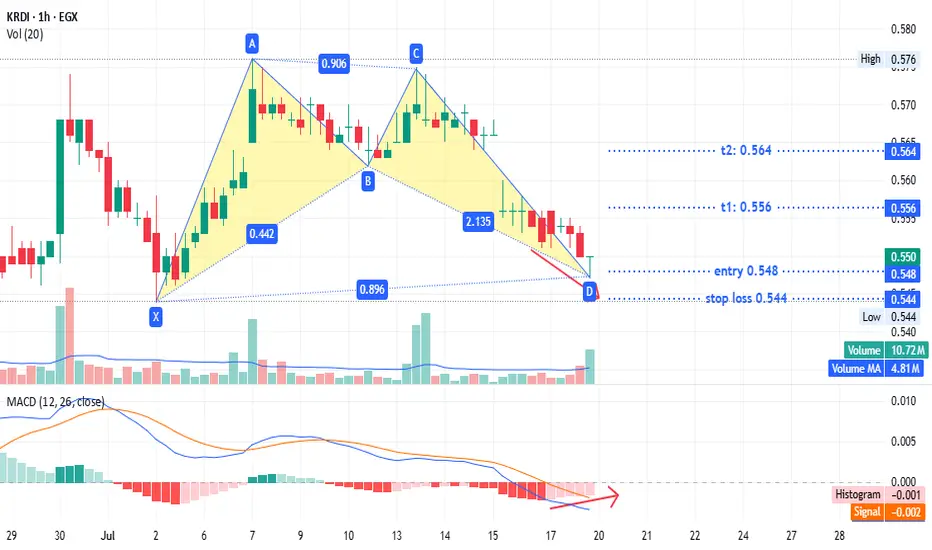
KRDI - just for fun but secured TASE:KRDI timeframe 1 hour
created bullish pattern
entry 0.548
stop loss : 0.544
T1: 0.556
T2: 0.564
MACD show positive diversion may that support our idea
Its not an advice for investing only my vision according to the data on chart
Please consult your account manager before investing
Thanks and good luck
KRDI trade ideas
KRDI Egypt is expected to target 0.750 after crossing 0.608Daily chart,
The stock EGX:KRDI is rebounding to enter the rising channel. Once above the rising trend line (around 0.607), the target will be 0.750 to 0.760 passing through resistance level at 0.658
Technical indicators:
RSI: positive
MACD: About to cross up the signal line
Entry (buy) can be made now at 0.590 - 0.597, and consider a stop loss below 0.580
Safer to enter above 0.608 after the breakout (crossing up) confirmation.

KRDI Egypt is expected to target 0.65 then 0.75Daily chart,
the stock EGX:KRDI has been trading above a rising trend line since Oct 2024. I see the price will rebounce from the current level 0.600 to test the resistance line R1.
After crossing R1 line at around 0.650 - 0.658, the next target will be R2 (around 0.750 - 0.760).
Technical indicators: RSI and MACD still need confirmation for a new entry (buy)
Note: A Resistance level at 0.670
Consider Stop Loss below 0.600 (closing)

#KRDI - Egyptian stock#KRDI time frame 1 hour
created a bullish Gartley pattern
Entry level around 0.59
Stop loss 0.575 ( estimated loss -2% ) -5% from currant prices
First target at 0.611 ( estimated profit around 4% ) achieved
Second target 0.633( estimated profit around 8% )
Third target 0.659 ( estimated profit 12% )
Note : First target already achieved so it will be good chance if prices fall back into entry zone.
NOTE : this data according to time frame I hour
Its not an advice for investing only my vision according to the data on chart
Please consult your account manager before investing
Thanks and good luck

KRDI: Ready to Break or Bounce? Watch These Levels!KRDI is setting up for a key move, with price holding above support at $0.62 and showing strong momentum on both the daily and hourly charts. If it reclaims $0.65 with volume, a breakout towards $0.68–$0.72 is in play. However, a pullback to $0.62 could offer a solid buy opportunity if support holds. Watching volume closely—confirmation is key. A drop below $0.60 would invalidate the setup. Let’s see how this plays out! 🚀📈

KrdiLevels on the Chart
Breaking above the Downtrend Line will be positive.
breaking under the Green line is Negative.
Caution.
