MASR is currently below its 200 SMA.MASR is currently below its 200 SMA. Given its tendency since 2023 to quickly reverse after crossing this line, it's best to await clearer price action before considering a safe investment.
MTIE trade ideas

MM Group Egypt - Quick trading between S & R lines 1-hour chart,
the stock EGX:MTIE is trading in a rising wedge. While this is a bearish chart pattern, we can trade between the support and resistance lines (7.60 - 8.00) for the next few weeks - or until breaking either boundaries.
In case of:
closing 3 hours below line S, the target will be 7.10
closing 3 hours above line R, the target will be 8.66
A near stop loss level should be considered.

MM group We notice a decline in the volume highs as they reach the low volume today, and the sideways movement and stability above the gap all show that we are close to the bottom. Support 6.8
Stop 6.55 with close
Resistance 7 Goals 7.25, 7.5 and 8 are the final goal.
I expect a strong movement this week.

Mtie Market Maker MapHello Dear Traders,
Decrypting The Algos!
Important Levels
On the Chart, "Horizontal Lines" are Based on Gann Square of 9. They work as Support/Resistance. Watch for Price action around those levels.
Jinny Gann Grid
Vertical lines work as timelines. Expect Reversals around them.
Next Near Resistance: 6.69 then 7.30
Near Support: 6.06 then 5.46
How to Read the Chart?
Zoom in to the Current Price! and see where the support and resistance are on the date you are checking the chart.
Wish you Best of Luck!

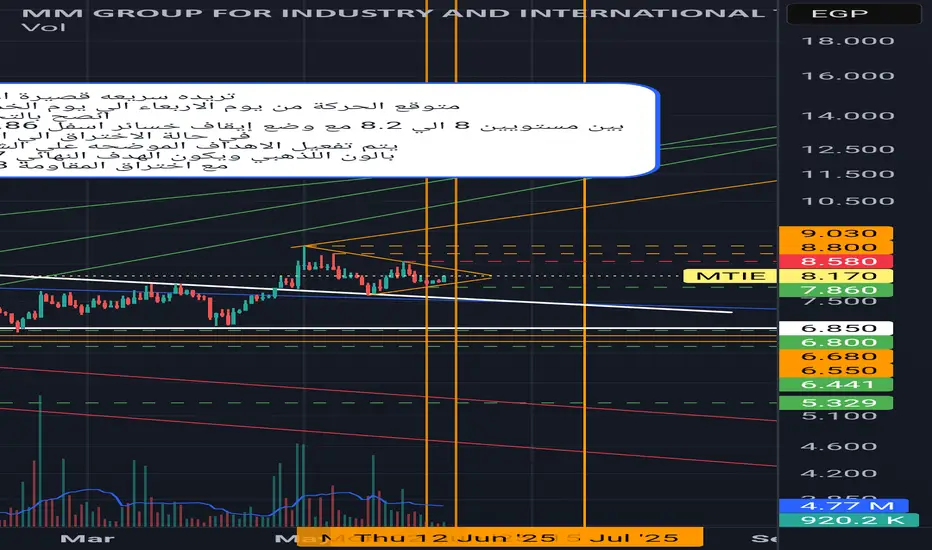
MTIE, Egypt, to target 11.50 weekly chartMTIE , Egypt,
On the weekly chart, crossing 8.20 will push the stock to target 11.50 on stages.
Stop loss level at 5.75 should be actively monitored.

MTIE positive outlookMTIE positive outlook but will consolidate
two more working days isa
targets are explained in the video idea

MM Group is about to cross the resistance; then 11.4Daily chart, the stock has formed an expanding triangle chart pattern, and is preparing to cross the Resistance line (blue).
After crossing, the target will be 11.4
Stop loss should be considered below 6.85

NEXT MARKET MOVE UP TO 2023NEXT MARKET MOVE UP TO 2023
At the bold black line, a major area,
At the orange line, a sub area
WE CAN UPDATE AFTER BROKEN

FIB ChannelsA Simple FIB Channels for the Long-term Uptrend & small Downtrend.
Entry was 6.20
1st Near resistance 6.98
Good Luck For All!

LONG term MM Group.Possible support and resistance . GL. horizontal lines are Support/Resistance . Vertical lines are time pivots

