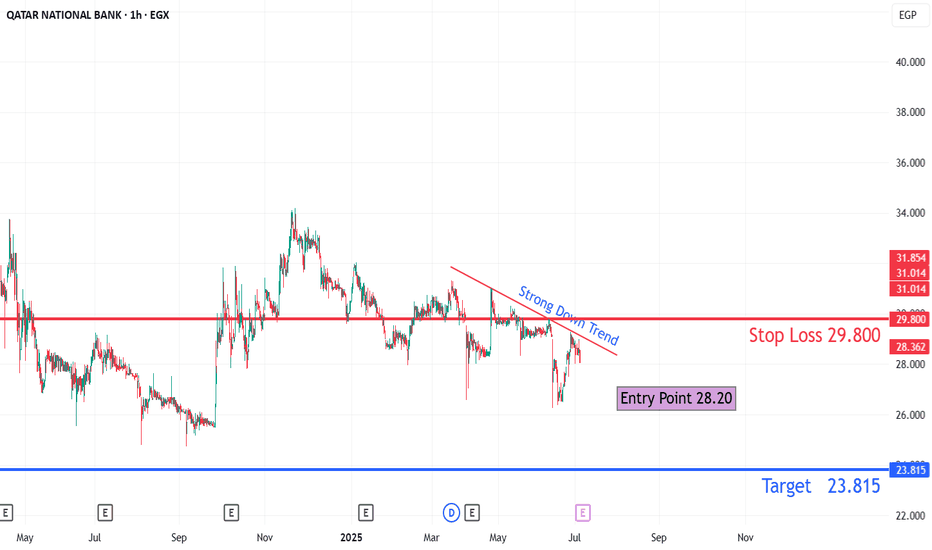
QNBE trade ideas
QNB Analysis with IndicatorsKey Observations:
Support & Resistance Zones:
Strong Resistance: 37.41 EGP (Previous high).
Current Resistance: 31.68 - 32.11 EGP (Needs a breakout for bullish continuation).
Support Levels: 31.54 EGP, 28.08 EGP, and 25.03 EGP.
Moving Averages (Blue & Red Lines):
Price is near moving averages, suggesting a retest of support or an early uptrend.
If the price stays above moving averages, it could confirm bullish momentum.
Indicators (MACD, RSI, Volume):
RSI: 54.74 (Neutral-Bullish). Needs to break above 60 to confirm strong bullish trend.
MACD: Slightly bullish crossover forming. Could signal momentum shift upward.
Volume Profile: High volume between 28-32 EGP, indicating accumulation.Trading Strategy Ideas:
📌 Bullish Scenario:
Buy above 32.11 EGP with a target of 47.41 EGP.
Stop loss below 29.50 EGP to minimize risk.
Confirmation: RSI above 60, MACD positive crossover, and increased volume.


