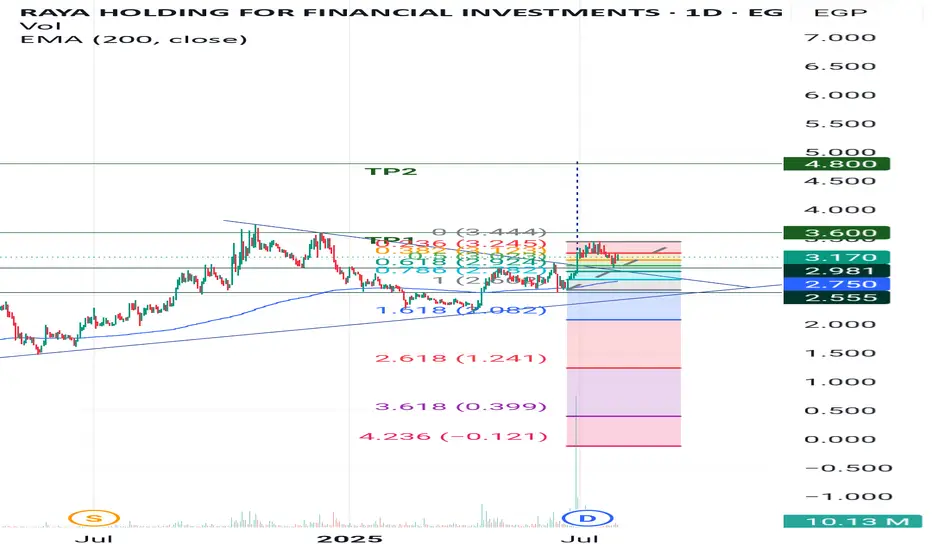
Rebound from significant support levelRAYA after breakthrough symmetric triangle pattern the stock just tested a significant support level 2.98 which considered 50% fibo retracement level, the potential targets are as follows:
- TP1: 3.6 "Short - medium term target"
- TP2: 4.8 "Long term target"
- SL: below 2.95 "current SL level"
Retra
0.357 EGP
1.69 B EGP
45.12 B EGP
473.56 M
About RAYA HOLDING FOR FINANCIAL INVESTMENTS
Sector
Industry
CEO
Ahmed Medhat M. Ibrahim Khalil
Website
Headquarters
6th of October
Founded
1999
ISIN
EGS690C1C010
FIGI
BBG000C2Y8X0
Raya Holding for Financial Investments SAE operates in the fields of information technology, data center outsourcing, contact center, smart buildings, consumer electronics, social media development, food and beverage, and land transport.The company was founded by Medhat Mohamed Ibrahim Khalil on May 9, 1999 and is headquartered in 6th of October, Egypt.
Related stocks
RAYA HOLDING: Bullish Rebound or Breakdown? Key Levels to Watch!RAYA HOLDING (EGX) is at a crucial decision point!
Trading near key support at 2.22 - 2.39 EGP, with a chance to rebound within the long-term bullish channel.
Breakout above 2.40 could lead to TP1 at 2.9 and TP2 at 3.45 🚀.
Bearish case? A breakdown below 2.1 could trigger further downside.
📊 RSI &

RAYA Egypt may go bullish towards 5.30 !Weekly chart,
I see a pre-formation of a widening rising wedge pattern, and the stock EGX:RAYA is preparing to go on a bullish movement towards the upper line R
There is a very strong resistance level at 3.00, then resistance levels at 3.60 and 3.74
(At each resistance level, be careful with you

RAYA Approaching Trendline with Bullish DivergenceRAYA is currently testing a key ascending trendline, showing signs of a potential reversal. The price action is forming bullish divergence on the RSI and other momentum indicators, suggesting a possible bounce toward previous resistance levels.
Key Observations:
✅ Price is nearing strong trendline

#RAYA Egyptian stock - great opportunity - great fundamental.#RAYA time frame 1 DAY
Created Gartley Bullish pattern , also there is positive diversion at RSI ( may that support our idea ) as follow :
Entry level around 2.70
Stop loss 2.55 ( estimated loss -5.50% )
First target at 3.00 ( with profit around 10% )
Second target 3.30 ( with profit around 20% )

Raya Holding (EGX) – Trendline Support with Upside PotentialHere’s a TradingView idea for your trendline approach setup with targets set to the previous top:
---
**Raya Holding (EGX) – Trendline Support with Upside Potential**
📉 **Technical Analysis:**
The stock is approaching a strong ascending trendline, acting as a dynamic support level. A potent

longKey Financial Metrics
Fair Value: 4.3 EGP (close to current levels, undervaluation is limited)
P/E Ratio: 5.1X (very low, indicating potential undervaluation)
Market Cap: 10.75B EGP
Price Target: 5.1 EGP (~18.6% upside from fair value)
Holding Period: 12 months
Financial Performance (9M 2024)
📈 Re

RAYA is preparing for a breakout! 30-min chart
The stock EGX:RAYA is preparing to breakout. The next target will be 3.01 then 3.19
The MACD indicator is almost crossing positively.
Current stop loss level is 2.70
Above 3.01 for 3 bars, the next target will be 3.19 then 3.25

MFPC-ABUK-SKPC-RAYA analysis :
MFPC-ABUK-SKPC-RAYA
Timeframe: 5 MINUTES OUTLOOK
Technical indicators :
1-VWAP
2-ELLIOT WAVES
3-ICHIMOKU

Great Opportunity ---- Sunday 28th Jan 24The demonstrated concept is based on FVG, Order Block, and Ichimoku Kinko Hyo. The narrative is in Arabic, and channeled toward Arabic speaking trader in CASE.
Disclaimer: this is not an investment proposal; if you want to invest consult your investment/wealth manager.

See all ideas
Summarizing what the indicators are suggesting.
Oscillators
Neutral
SellBuy
Strong sellStrong buy
Strong sellSellNeutralBuyStrong buy
Oscillators
Neutral
SellBuy
Strong sellStrong buy
Strong sellSellNeutralBuyStrong buy
Summary
Neutral
SellBuy
Strong sellStrong buy
Strong sellSellNeutralBuyStrong buy
Summary
Neutral
SellBuy
Strong sellStrong buy
Strong sellSellNeutralBuyStrong buy
Summary
Neutral
SellBuy
Strong sellStrong buy
Strong sellSellNeutralBuyStrong buy
Moving Averages
Neutral
SellBuy
Strong sellStrong buy
Strong sellSellNeutralBuyStrong buy
Moving Averages
Neutral
SellBuy
Strong sellStrong buy
Strong sellSellNeutralBuyStrong buy
Displays a symbol's price movements over previous years to identify recurring trends.
Frequently Asked Questions
The current price of RAYA is 3.160 EGP — it has increased by 0.32% in the past 24 hours. Watch RAYA HOLDING FOR FINANCIAL INVESTMENTS stock price performance more closely on the chart.
Depending on the exchange, the stock ticker may vary. For instance, on EGX exchange RAYA HOLDING FOR FINANCIAL INVESTMENTS stocks are traded under the ticker RAYA.
RAYA stock has fallen by −0.31% compared to the previous week, the month change is a −0.63% fall, over the last year RAYA HOLDING FOR FINANCIAL INVESTMENTS has showed a 39.82% increase.
RAYA reached its all-time high on Oct 28, 2024 with the price of 3.740 EGP, and its all-time low was 0.048 EGP and was reached on Oct 10, 2011. View more price dynamics on RAYA chart.
See other stocks reaching their highest and lowest prices.
See other stocks reaching their highest and lowest prices.
RAYA stock is 1.90% volatile and has beta coefficient of 0.91. Track RAYA HOLDING FOR FINANCIAL INVESTMENTS stock price on the chart and check out the list of the most volatile stocks — is RAYA HOLDING FOR FINANCIAL INVESTMENTS there?
Today RAYA HOLDING FOR FINANCIAL INVESTMENTS has the market capitalization of 13.57 B, it has increased by 1.81% over the last week.
Yes, you can track RAYA HOLDING FOR FINANCIAL INVESTMENTS financials in yearly and quarterly reports right on TradingView.
RAYA net income for the last quarter is 578.26 M EGP, while the quarter before that showed 455.85 M EGP of net income which accounts for 26.86% change. Track more RAYA HOLDING FOR FINANCIAL INVESTMENTS financial stats to get the full picture.
Yes, RAYA dividends are paid annually. The last dividend per share was 0.04 EGP. As of today, Dividend Yield (TTM)% is 1.26%. Tracking RAYA HOLDING FOR FINANCIAL INVESTMENTS dividends might help you take more informed decisions.
RAYA HOLDING FOR FINANCIAL INVESTMENTS dividend yield was 1.42% in 2024, and payout ratio reached 10.14%. The year before the numbers were 0.00% and 0.00% correspondingly. See high-dividend stocks and find more opportunities for your portfolio.
EBITDA measures a company's operating performance, its growth signifies an improvement in the efficiency of a company. RAYA HOLDING FOR FINANCIAL INVESTMENTS EBITDA is 4.40 B EGP, and current EBITDA margin is 9.75%. See more stats in RAYA HOLDING FOR FINANCIAL INVESTMENTS financial statements.
Like other stocks, RAYA shares are traded on stock exchanges, e.g. Nasdaq, Nyse, Euronext, and the easiest way to buy them is through an online stock broker. To do this, you need to open an account and follow a broker's procedures, then start trading. You can trade RAYA HOLDING FOR FINANCIAL INVESTMENTS stock right from TradingView charts — choose your broker and connect to your account.
Investing in stocks requires a comprehensive research: you should carefully study all the available data, e.g. company's financials, related news, and its technical analysis. So RAYA HOLDING FOR FINANCIAL INVESTMENTS technincal analysis shows the buy rating today, and its 1 week rating is buy. Since market conditions are prone to changes, it's worth looking a bit further into the future — according to the 1 month rating RAYA HOLDING FOR FINANCIAL INVESTMENTS stock shows the buy signal. See more of RAYA HOLDING FOR FINANCIAL INVESTMENTS technicals for a more comprehensive analysis.
If you're still not sure, try looking for inspiration in our curated watchlists.
If you're still not sure, try looking for inspiration in our curated watchlists.