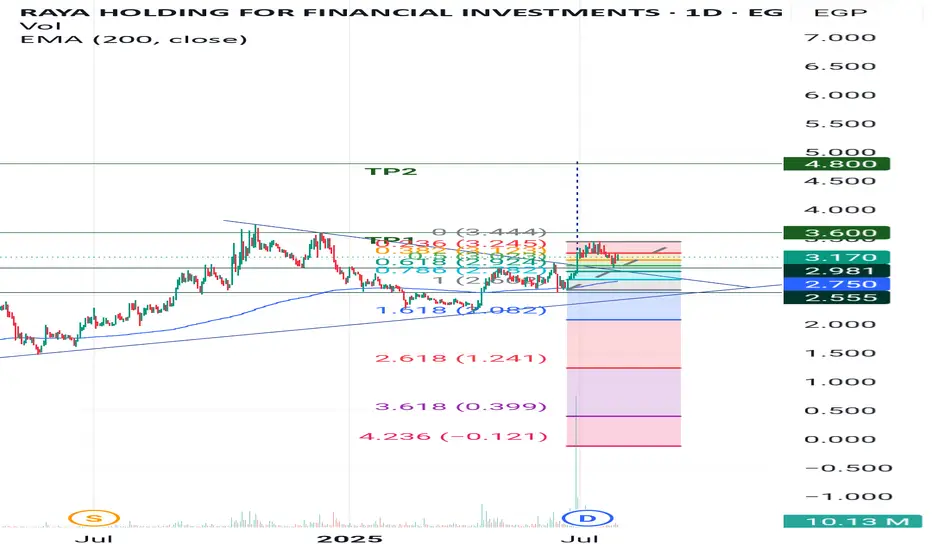
Rebound from significant support levelRAYA after breakthrough symmetric triangle pattern the stock just tested a significant support level 2.98 which considered 50% fibo retracement level, the potential targets are as follows:
- TP1: 3.6 "Short - medium term target"
- TP2: 4.8 "Long term target"
- SL: below 2.95 "current SL level"
Retracement SL is advised.
RAYA trade ideas
RAYA HOLDING: Bullish Rebound or Breakdown? Key Levels to Watch!RAYA HOLDING (EGX) is at a crucial decision point!
Trading near key support at 2.22 - 2.39 EGP, with a chance to rebound within the long-term bullish channel.
Breakout above 2.40 could lead to TP1 at 2.9 and TP2 at 3.45 🚀.
Bearish case? A breakdown below 2.1 could trigger further downside.
📊 RSI & Stoch RSI hint at potential momentum shift—what’s your take? Let’s discuss!

RAYA Egypt may go bullish towards 5.30 !Weekly chart,
I see a pre-formation of a widening rising wedge pattern, and the stock EGX:RAYA is preparing to go on a bullish movement towards the upper line R
There is a very strong resistance level at 3.00, then resistance levels at 3.60 and 3.74
(At each resistance level, be careful with your profits!)
The technical confirmation is closing 2 weeks above 2.45 for a new entry (buy)
Long Term Targets 4.00, 4.30, 4.50, 5.00, 5.30
Note: Stop Loss should be considered below 2.30 - 2.27

RAYA Approaching Trendline with Bullish DivergenceRAYA is currently testing a key ascending trendline, showing signs of a potential reversal. The price action is forming bullish divergence on the RSI and other momentum indicators, suggesting a possible bounce toward previous resistance levels.
Key Observations:
✅ Price is nearing strong trendline support.
✅ Bullish divergence forming on RSI and other indicators.
✅ Volume is stabilizing, indicating potential accumulation.
✅ First target: 2.58 (major resistance), then 3.24+ if momentum continues.
✅ Stop-loss below 2.10 to manage risk.
A confirmed breakout above short-term resistance could trigger a stronger upside move. Waiting for confirmation before entering a position is crucial!
What are your thoughts? 🚀📈not financial advice

#RAYA Egyptian stock - great opportunity - great fundamental.#RAYA time frame 1 DAY
Created Gartley Bullish pattern , also there is positive diversion at RSI ( may that support our idea ) as follow :
Entry level around 2.70
Stop loss 2.55 ( estimated loss -5.50% )
First target at 3.00 ( with profit around 10% )
Second target 3.30 ( with profit around 20% )
Third target 3.50 ( with profit 28% )
NOTE : this data according to time frame I DAY , it`s may take period up to 3 months to achieve targets , you must study well the Alternative opportunities before invest in this stock .
Its not an advice for investing only my vision according to the data on chart
Please consult your account manager before investing
Thanks and good luck

Raya Holding (EGX) – Trendline Support with Upside PotentialHere’s a TradingView idea for your trendline approach setup with targets set to the previous top:
---
**Raya Holding (EGX) – Trendline Support with Upside Potential**
📉 **Technical Analysis:**
The stock is approaching a strong ascending trendline, acting as a dynamic support level. A potential bounce from this level could trigger a move towards previous resistance zones. The MACD is showing signs of bullish divergence, suggesting a possible reversal.
📌 **Trade Plan:**
- **Entry:** Near the trendline support with confirmation of a bounce.
- **Stop Loss:** Below the trendline and recent lows to manage risk.
- **Target Levels:**
1️⃣ **First Target:** 2.478 – A key resistance level and volume cluster.
2️⃣ **Second Target:** 3.243 – A previous strong resistance zone.
3️⃣ **Final Target:** 3.752 – The previous high, where selling pressure might emerge.
📊 **Indicators & Confirmation:**
- MACD forming bullish divergence, signaling momentum shift.
- Price approaching a strong support level with high probability of a bounce.
- Volume profile suggests strong interest at higher levels.
🚀 **Final Thought:**
A well-structured trade with a favorable risk/reward ratio. A bounce from the trendline could lead to a strong upside move, aiming for previous highs. Monitor price action and volume for confirmation!
#Trading #StockMarket #TechnicalAnalysis #EGX
---
Not Financial Advice! 🚀

longKey Financial Metrics
Fair Value: 4.3 EGP (close to current levels, undervaluation is limited)
P/E Ratio: 5.1X (very low, indicating potential undervaluation)
Market Cap: 10.75B EGP
Price Target: 5.1 EGP (~18.6% upside from fair value)
Holding Period: 12 months
Financial Performance (9M 2024)
📈 Revenue Growth: +42.4% YoY (Strong top-line expansion)
📈 Net Profit Growth: +161% YoY (Impressive earnings surge)
📈 Quarterly Revenue Growth: +49.6% YoY
📈 Quarterly Net Profit Growth: +270% YoY
These numbers indicate strong operational efficiency, and the net profit margin of 4% is stable.
investment Outlook
✅ Bullish Signals:
✔ Low P/E (5.1X) → Indicates the stock is cheap compared to earnings
✔ Strong Revenue & Profit Growth → 42.4% revenue and 161% net profit growth YoY show business expansion
✔ Solid Quarterly Performance → 270% net profit growth YoY is a strong indicator of continued momentum
❌ Bearish Signals:
Market conditions & liquidity low

RAYA is preparing for a breakout! 30-min chart
The stock EGX:RAYA is preparing to breakout. The next target will be 3.01 then 3.19
The MACD indicator is almost crossing positively.
Current stop loss level is 2.70
Above 3.01 for 3 bars, the next target will be 3.19 then 3.25

MFPC-ABUK-SKPC-RAYA analysis :
MFPC-ABUK-SKPC-RAYA
Timeframe: 5 MINUTES OUTLOOK
Technical indicators :
1-VWAP
2-ELLIOT WAVES
3-ICHIMOKU

Great Opportunity ---- Sunday 28th Jan 24The demonstrated concept is based on FVG, Order Block, and Ichimoku Kinko Hyo. The narrative is in Arabic, and channeled toward Arabic speaking trader in CASE.
Disclaimer: this is not an investment proposal; if you want to invest consult your investment/wealth manager.

RAYA to target 3.5, then 5.45Weekly chart, RAYA should trade between the green and blue lines, then cross at 3.49 - 3.46
Technical indicator MACD is confirming this uptrend.
Above the blue line (3.50), the target will be 5.45
Stop loss 2.75


RAYA Buy signalI think RAYA is going to increase reaching good levels (2.8 EGP) and (3.36 EGP) in short term (~2 days) and (~10 days)
