NAS100 - Bullish Setup BuildingPair: NASDAQ (NAS100)
Bias: Bullish
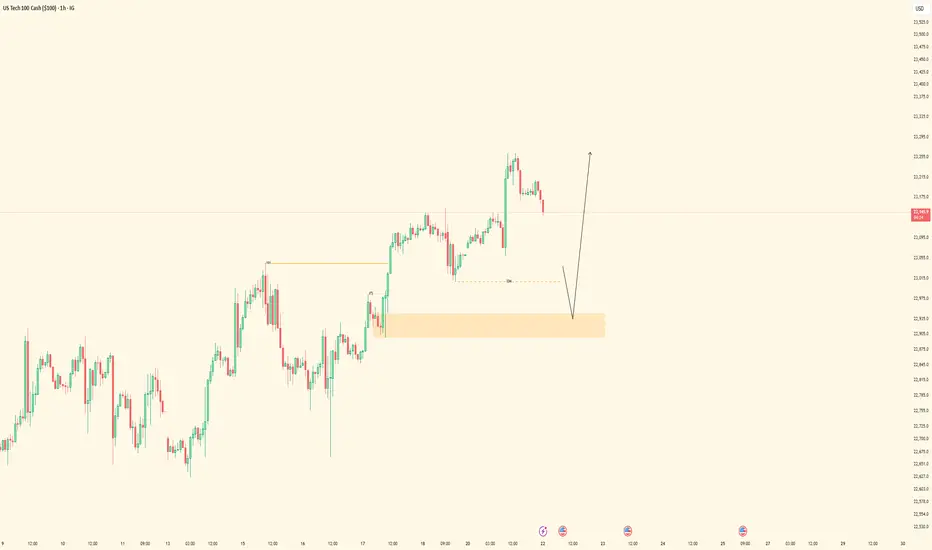
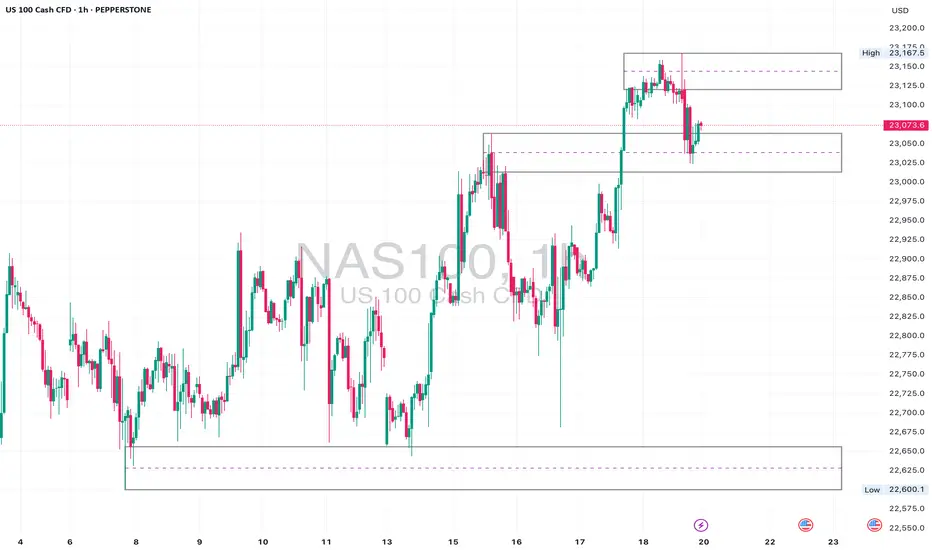
HTF Overview: 1H structure holding bullish after recent break of internal highs. Price pulling back toward a key demand zone.
LTF Confirmation: Waiting for price to mitigate the 1H Order Block, then drop to lower timeframes (15M → 5M) for confirmation entries.
Entry Zone: Watching for bullish reaction within OB, ideally paired with inducement or liquidity sweep before shift.
Targets: Short-term target is the next 1H high — extended targets align with overall bullish momentum continuation.
Mindset Note: Patience over prediction. Let price tap into the zone and confirm — don’t chase, just position smart.
Bless Trading!
NDQ100 trade ideas
#NDQ - Monthly Targets: 23721.73 or 21387.86?Date: 03-07-2025
#NDQ - Current Price: 22641.89
Pivot Point: 22554.80 Support: 22276.15 Resistance: 22835.11
Upside Targets:
Target 1: 23028.36
Target 2: 23221.62
Target 3: 23471.67
Target 4: 23721.73
Downside Targets:
Target 1: 22082.06
Target 2: 21887.98
Target 3: 21637.92
Target 4: 21387.86

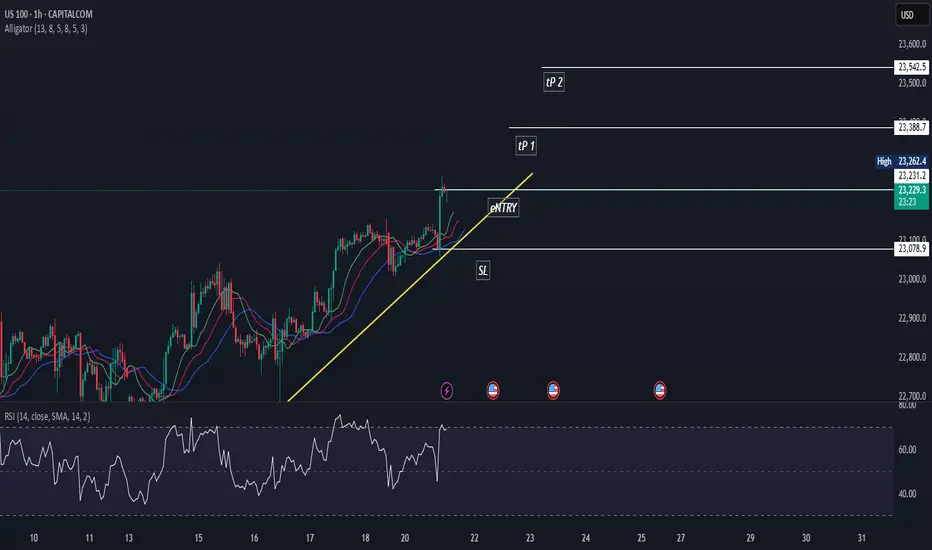
US100US100 is in strong bullish trend.
Alligator mouth is open which shows us trend will go further upward.
All sign shows that trend will continue.
We buy aT cmp.

NASDAQ (CASH100) SHORT - Double TOP H4Risk/reward = 11.3
Entry price = 23 190
Stop loss price = 23 270.4
Take profit level 1 (50%) = 22 674
Take profit level 2 (50%) = 22 053
All variables met, and entered the trade.
What is everyone's thoughts on shorting or longing cash100?
NAS100 | FLUSHPOINTNas1oo is pulling back into HTF keyzones, down below looking to catch sellers to the upside so trade is a bit riskier but we are looking for upside moves overally

NAS100 - Stock Market Awaits Tariffs!The index is trading above the EMA200 and EMA50 on the 1-hour timeframe and is trading in its ascending channel. The target for this move will be the channel ceiling, but if it corrects towards the indicated support area, it is possible to buy Nasdaq with better reward to risk.
In a week once again clouded by trade tariff threats, the stock market reacted cautiously at times. However, what truly captured investors’ attention was growing concern over potential political interference in Federal Reserve policymaking—a development that influenced market sentiment and shifted the focus away from geopolitical tensions.
Despite political headwinds, U.S. economic data continued to show signs of resilience. Investors this week were more focused on corporate earnings and inflation data than on trade war rhetoric or speculation about Jerome Powell’s possible dismissal. While betting markets such as Polymarket raised the odds of Powell being removed to 40%, legally, the president cannot dismiss the Fed Chair without a valid cause—and allegations like “lying to Congress” lack legal standing.
Still, the greater danger lies not in Powell’s dismissal itself but in the potential erosion of the Federal Reserve’s independence—something that could unsettle investors in stocks, bonds, and currencies alike. Analysts expect Trump may soon appoint an ally as an informal or “shadow” Fed Chair, a move that would elevate political risk in financial markets.
Nevertheless, markets are continuing to operate along familiar lines: equities focus on corporate profits, the bond market on inflation and growth, and the currency market on relative returns. For now, the takeaway is clear: Trump is winning—but perhaps only temporarily.
Rick Rieder, Chief Investment Officer at BlackRock, noted that despite trade tensions and inflation concerns, tariffs have had limited impact so far. Following the June CPI report, he pointed out that inflation ticked up slightly—core CPI rose by 0.23% monthly and 2.93% annually, while headline inflation was up 0.29% monthly and 2.67% annually—but the broader trend still reflects easing price pressures.
Rieder attributed this to companies acting preemptively, managing inventory and adjusting supply chains to avoid passing on costs to consumers. He also cited easing wage pressures and a weakening labor market as factors contributing to the decline in inflation.
As such, Rieder believes the Federal Reserve might lower interest rates in September, though a cut in July is less likely, as the central bank would prefer to assess the impact of tariffs first.
According to the Wall Street Journal, Treasury Secretary Scott Besant privately urged Trump not to remove Jerome Powell. Besant warned that such an action could cause unnecessary turbulence in financial markets and the broader economy, and would also face legal and political hurdles. He emphasized that the Fed is already signaling potential rate cuts later this year, and confronting Powell now would be unwarranted.
A source noted that Besant reminded Trump the economy is performing well, and markets have responded positively to administration policies—another reason to avoid drastic moves.
On another front, rising long-term bond yields have become a concern for Besant, as they increase the government’s borrowing costs.He has been working to keep yields in check and believes firing Powell could further escalate them—hence his conversation with Trump aimed at dissuasion.
The coming week will begin with market attention on the European Central Bank’s rate decision, which could set the tone for Eurozone monetary policy in the second half of the year. Meanwhile, a series of key U.S. economic data will be released, providing a clearer view of conditions in employment, production, and housing.
On Tuesday, Jerome Powell will deliver an opening speech at an official event in Washington. While he is unlikely to directly address Trump’s recent verbal attacks, investors will be listening closely for any subtle references to Fed independence or interest rate direction.
On Wednesday, the June existing home sales report will be released, which could indicate whether housing demand remains steady or is weakening.
Thursday will be a packed day on the economic calendar. The ECB’s rate decision will be announced—an event under heavy scrutiny amid Eurozone stagnation. In the U.S., preliminary PMI data from S&P, weekly jobless claims, and new home sales will also be published.
Finally, the week will wrap up on Friday with the release of U.S. durable goods orders—an important gauge of capital investment in the manufacturing sector.

A very ambitious LONG I have entered LONG on nas100 once it retested the break of the double top.
No BS, just a simple trade... no spider webs on the screen, no crazy, imaginary strategy..
US100 longLet market structure speak for itself! ;)
Looks like a clear long position... follow the trend!!!! <3
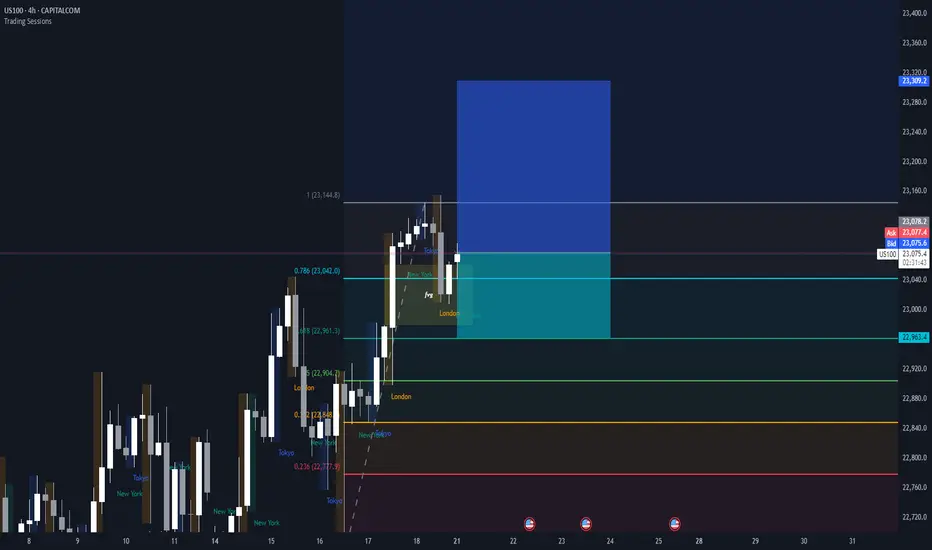
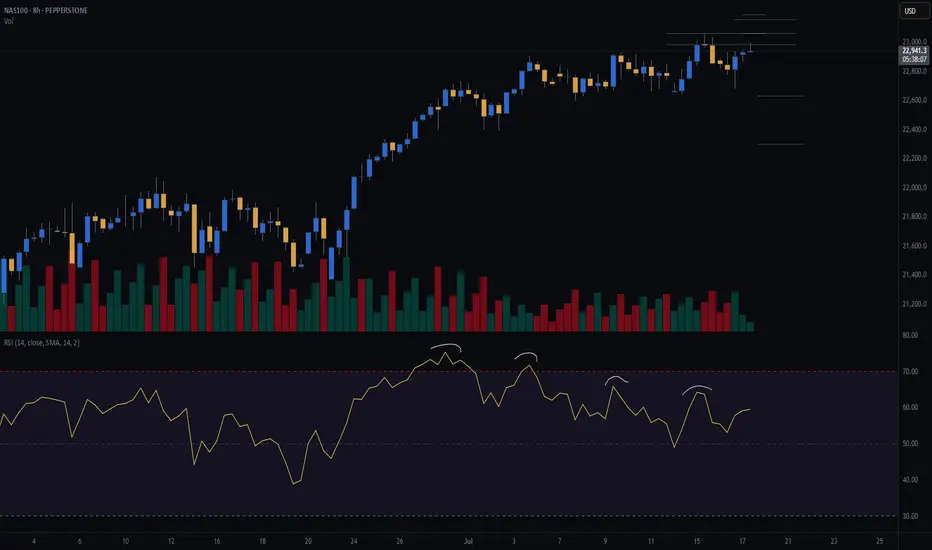
Nas100• Daily: Price is nearing the upper boundary of a rising wedge pattern — showing signs of overextension.
• 4H: Strong bullish structure with clean breaks and retests of minor consolidation ranges.
• 1H: Small range developing after recent high. A deeper pullback to 22,960–22,880 would offer a cleaner entry for continuation.
⚠️ Watch For:
• Wedge resistance on the daily chart.
• Bullish continuation only valid above 23,040.
• If we break below the 4H support zone (around 22,880), short-term pullbacks are likely.
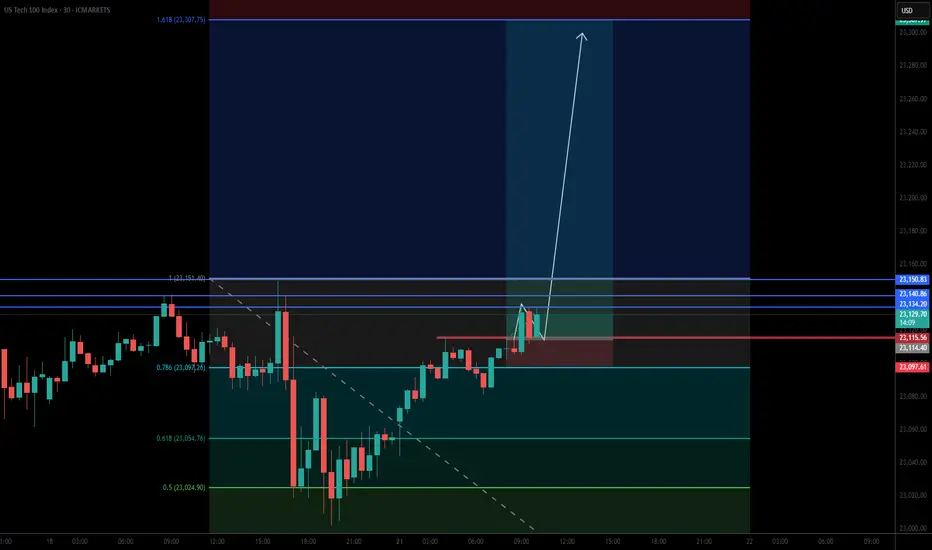
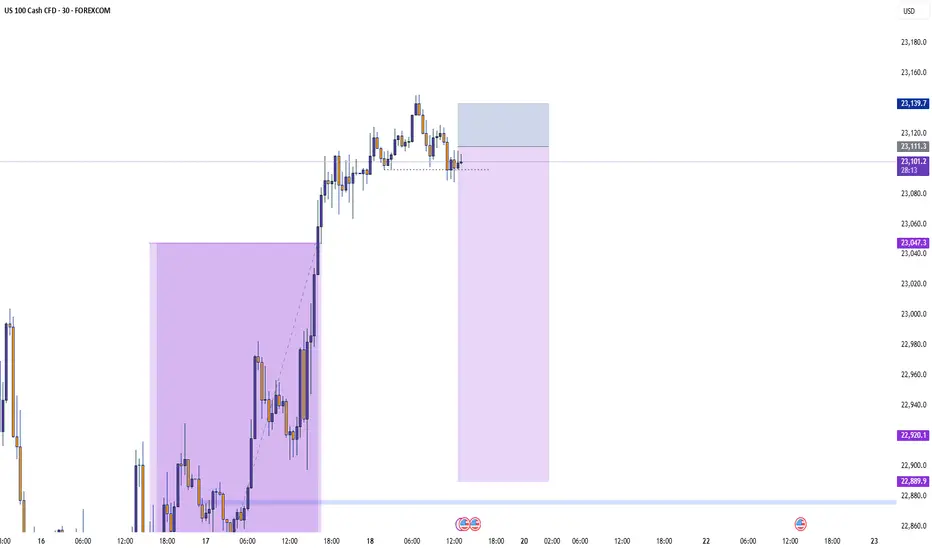
NAS100 - Bullish Trend Continuation Setup• Pair: NAS100 (Nasdaq)
• Bias: Bullish
• HTF Overview (4H):
• Strong bullish structure and momentum from last week.
• Price consistently printing higher highs with no signs of reversal.
• MTF Refinement (30M):
• Waiting for a clean sweep of SSL (sell-side liquidity).
• Looking for price to dip into 30M OB for continuation opportunity.
• Entry Zone:
• Watch 30M OB — once price sweeps liquidity and confirms, execute long.
• Targets:
• Structure highs / previous weekly highs.
• Mindset Note:
• Simple execution plan — ride the trend, trust the structure.
• Wait for confirmation before switching from analyst to trader mode.
Bless Trading!
NAS100 - Pattern & SMA PerspectiveDear Friends in Trading,
How I see it,
Not much new to report...
Exhaustion rising wedge continuation
1) Short corrections, new demands keep forming.
2) Can price break out to ignite an even steeper climb?
3) Or will price keep on respecting the wedge above 22900?
4) Still no catalyst to ignite a free fall...
I sincerely hope my point of view offers a valued insight.
Thank you for taking the time study my analysis.

7/21/25 ((NAS100)) analysisPrice is definitely going up
may come down to quickly tap the daily FVG first
perhaps in the beginning of the week
---Monday/Tuesday style but not married to that Idea
could also come back to hit that volume weekly line thing
I just decided to implement lol who knows
anyways I plan to be in BUYS all week long BABYYY

NASDAQ Short OpportunityPrice formed a distribution schematic 1 and currently forming the LPSY at OTE Level

Risk off The cycle low is due 10/10 -20th The Bullish wave count is that we are ending wave 1 of 5 in super cycle blowoff wave 2 would drop in a ABC decline and drop back to .382 alt 50% of the whole rally from 4835 low . This is the bull wave count ! The bearish wave count is that we are ending the final 5th wave up from 2020 low march 23th see my work calling for a panic into 3/18/3/20 2020 the low was 3/23 20 into perfect math at 2191 as was the call for 3510 to 3490 low and the 4835 low all are in near perfect math . My worry for this oct 10 to the 20th Is I see a 1987 like decline taking out the 4835 in a wave E CRASH . Under all three counts I moved to a 110 % short. best of trades WAVETIMER
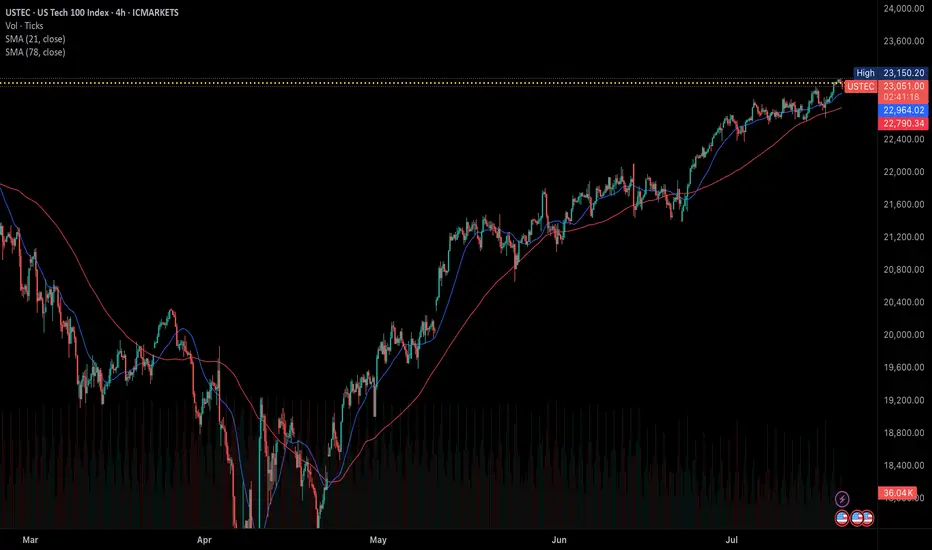
US consumer sentiment improved in Jun could boost US indices The US July Michigan Consumer Sentiment Index increased to 61.8 from 60.7, while the 12-month inflation expectation decreased to 3.6% from 4% in the previous month. This suggests an easing of inflation concerns and improved consumption optimism.
This data, coupled with recent stronger Retail Sales figures, continues to support expectations for robust US economic growth amidst trade tariff uncertainties. Inflation is anticipated to have a limited short-term impact. Concurrently, the approval for AMD and Nvidia (NVDA) to export AI chips to China further bolsters the US tech sector.
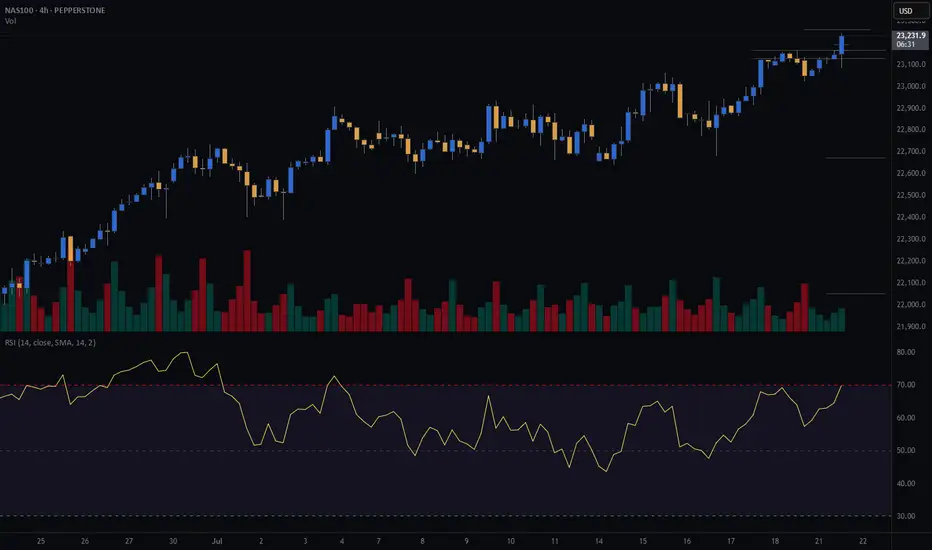
The USTEC is currently in an upward trend, having reached a new high before a slight retreat. It is trading above both the EMA21 and EMA78, indicating higher highs and higher lows, suggesting the rally could persist.
Should the USTEC continue its surge, the index may test the resistance level at 23,200. Conversely, a failure to maintain above the trendline could trigger a decline towards the next support at 22,600.
By Van Ha Trinh - Financial Market Strategist from Exness
NAS100 (CASH100) SHORT - head and shoulders 30minRisk/reward = 3.9
Entry price = 23 137.9
Stop loss price = 23 153.9
Take profit level 1 (50%) = 23 071
Take profit level 2 (50%) = 23 060
Still need to validate a few variables.
Lets goooooo

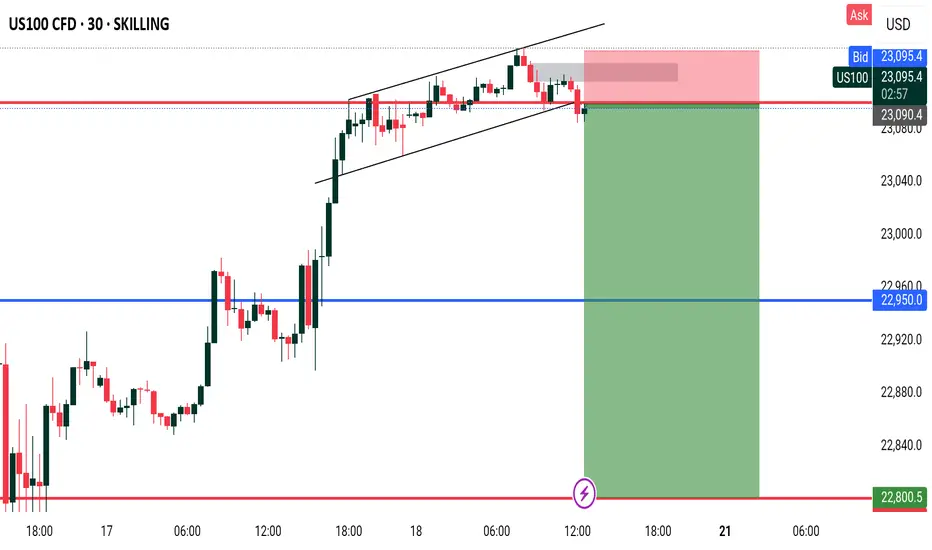
Weekly Close High to HOLD?As expected Nas100 will end in a weekly high after hitting a nice fresh record due to TSMI stock among other things like Trump walking back on firing Jermone Powell.
Technicals tell me that this is extremely overbought and I wonder if this will continue I cannot believe this rally. AS LONG as it holds the 23100 to 23150 range then it could break out again and set another high but I would be cautiously optimistic. Somebody's got to take the profit!
SellRejection Level
Daily Volume
Market Structure Shift
London US Session
Trend Line Break
Untapped Order Point
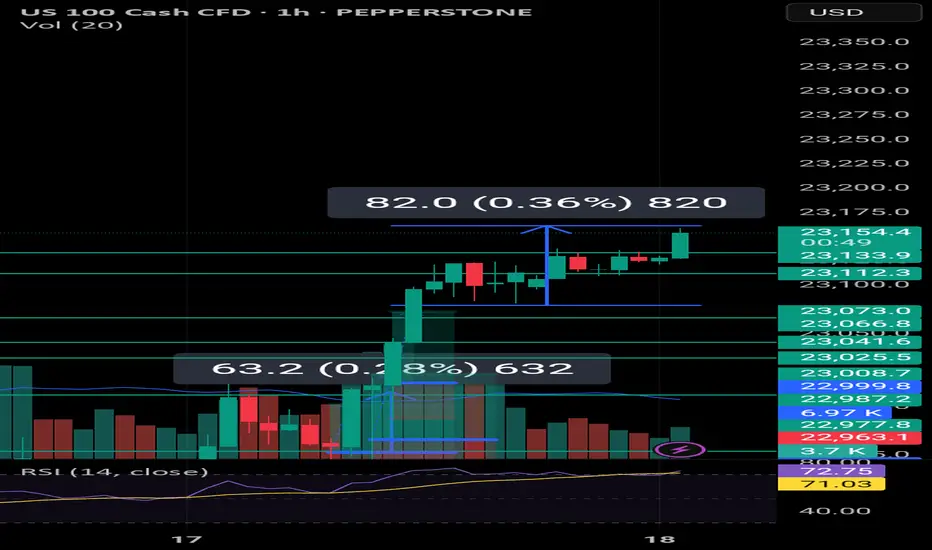
NASDAQ100 Hits Target at 23170 – Watch for Breakout or PullbackNASDAQ100 Tests ATH – Key Decision Zone at 23170
New ATH Achieved:
NASDAQ100 recorded a new All-Time High (ATH), hitting our target at 23170 precisely as projected.
Currently, price is consolidating below 23170. Sustained rejection at this level could trigger a short-term bearish pullback toward 23010. A deeper correction may extend to 22900 or even 22815.
However, a clean breakout above 23170 would confirm bullish continuation, with the next target at 23350.
Key Levels
• Pivot: 23170
• Resistance: 23250 / 23350
• Support: 23010 / 22900 / 22815
Outlook:
• Bullish above 23170
• Bearish below 23170 (short-term pullback zone)

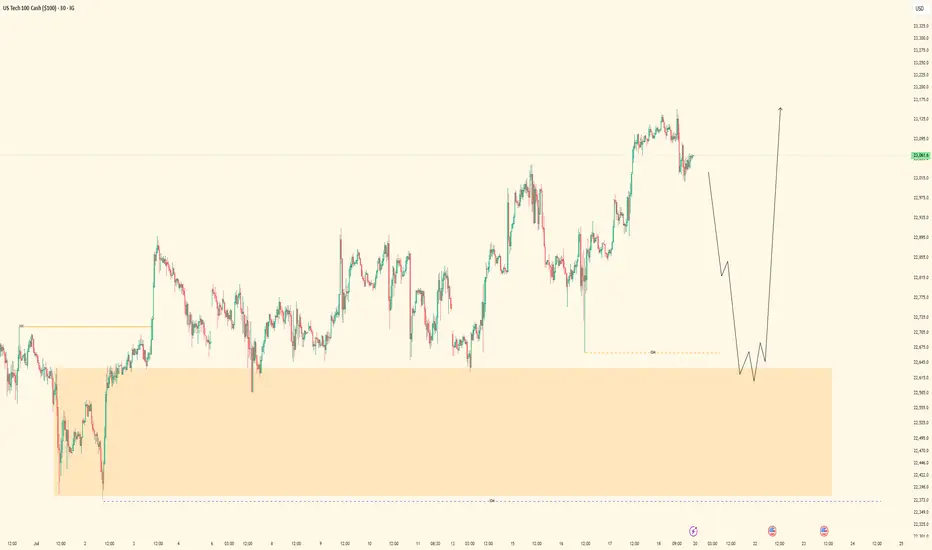
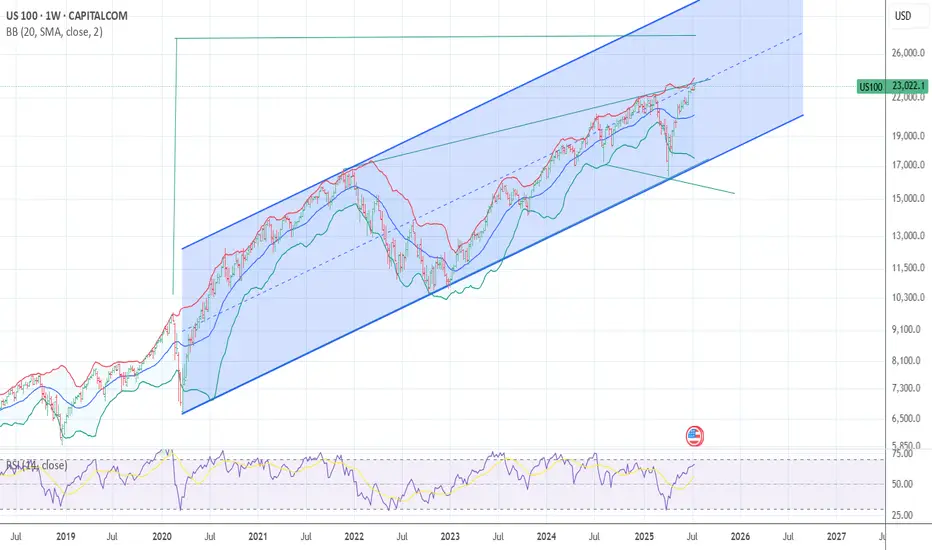
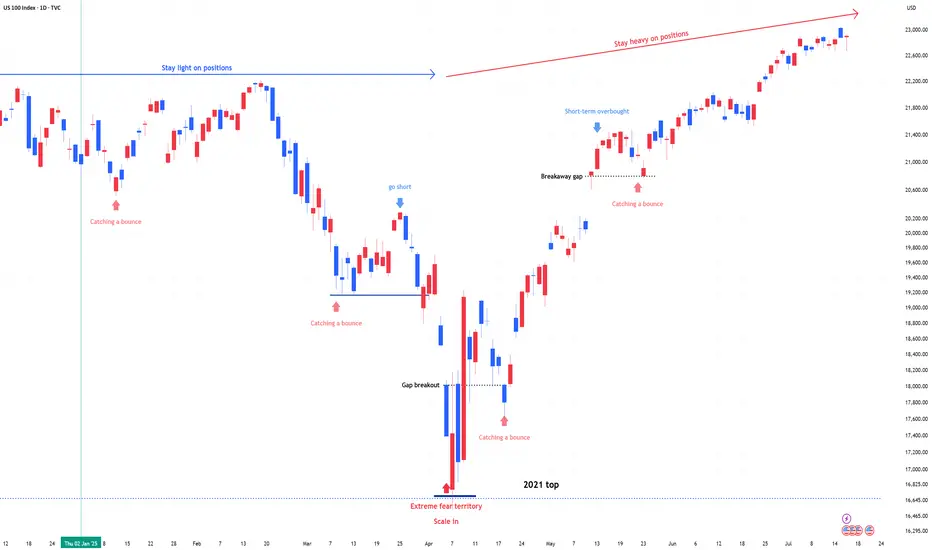
US 100 (NDQ) : Stay Heavy on Positions1) April Fear & Buy Signals
In early April, the Nasdaq 100 experienced a sharp sell-off, triggering extreme fear sentiment across the market.
At that point, scale-in buy signals appeared—classic "buy the fear" conditions.
2) Current Market State: No More Fear, but Watching
Since then, the market has stabilized.
The fear has disappeared, but we are still in a wait-and-see mode as traders assess the next move.
Momentum is holding, but participation remains cautious.
3) Stay Heavy on Positions
Despite short-term uncertainty, I’m maintaining an overweight position on the Nasdaq 100.
As long as we don’t see a major breakdown, the bias remains bullish.
NAS100 (CASH100) SHORT - Double Top H8Risk/reward = 4.6
Entry price = 23 063
Stop loss price = 23 190
Take profit level 1 (50%) = 22 635
Take profit level 2 (50%) = 22 303
Still waiting for confirmation on some variables.
For example, need H8 candle to close in range and volume to validate, amongst other variables.