US2000 trade ideas

RUT may be leading the way for indices RUT has currently had a strong rejection of a butterfly top and looks to make a possible break lower. This whipsawing of the long term range the RUT has traded in may be early signs the RUT is getting ready to break (Note, even in times this does make a break sometimes there's a final failed new high - shorts at this level can do well but it's worth stopping out and trying again higher if the bulls rip).

Russell 2000 Complex Wave 4If Wave 4 to finish at my target of 2088 then we might start Wave 5 to 2.5k and ideally to 3k target.
If this level gets broken then the next support level is 1920
GOODLUCK!

2100 is the most important support level ..!This is the most important week of the year for small caps!
If Russell 2000 closed below 2100 this week, this must be considered as a rectangular top in the weekly chart!
and we are less than 1% away from the 2100 level!
The Russell 2000 Index is a small-cap stock market index that makes up the smallest 2,000 stocks in the Russell 3000 Index.
The Russell 3000 Index is a capitalization-weighted stock market index that seeks to be a benchmark of the entire U.S stock market.
You can see the most important support (green lines) and resistance (red lines) to watch in the coming days in these charts!
Best,
Moshkelgosha
DISCLAIMER
I’m not a certified financial planner/advisor, a certified financial analyst, an economist, a CPA , an accountant, or a lawyer. I’m not a finance professional through formal education. The contents on this site are for informational purposes only and do not constitute financial, accounting, or legal advice. I can’t promise that the information shared on my posts is appropriate for you or anyone else. By using this site, you agree to hold me harmless from any ramifications, financial or otherwise, that occur to you as a result of acting on information found on this site.

Getting rejection at that level. Look for a breakBreak the level and we should be able to make it back up to the trendline. Price may move fast after the break from the history.


Russell 2000 touch downs.According to RSI this is a trough lands. RSI is just oversold way oversold since Covid's low.

Small Caps Oversold, AgainThey got a beating 12/09, Tues gap filled EOD, RSI near oversold, expect turn higher soon, watch the indicators!

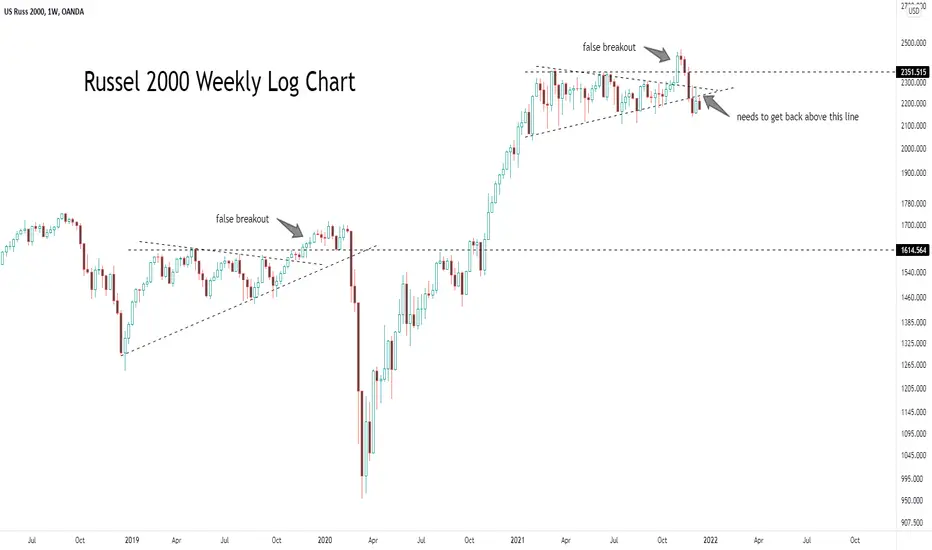
Reminiscence of March 2020.Russel 2000 Weekly Log Chart needs to recapture some key break down lines.
$RTY | WEEKLY WATCHLIST 12/13$RTY $IWM 1D
We stayed patient and got the exact pullback we were looking for. Now, we must hold $2170-2200. If we do, targeting wave 3 high of $2365 immediately.

RUT'S RSI lowest since Covid's crash !Omicron + Speedy tapering are the keys
Or could be the start of a correction !
Already 12% down form top !

RTY Expansion zone - Trend TBDWe're experiencing another Expansion zone as highlighted before. Market will be deciding on Trend. Under that average price will result in a down trend.

Look for gold to overtake Russell first.You just can't overtake a 7 year rate of change that easily.
While we wait for Nasdaq to roll over vs gold, let's look at the weakest of US Equities to roll over first!

RUT snap back rally Market is following Boeing stock with a delay. If anything we should reach top 2900/3000 in feb 2022 and than collapse 80 percent by march 2023

$RTY | WEEKLY WATCHLIST 11/29Have been tracking this for awhile now. Expecting a base to build here before our next leg higher towards $2650+. Eyeing a position on this one very soon. ($IWM)

A good place to start scaling for a bounceI think this is a good place to start scaling into the RTY longer-term or short-term potential bounce.
In 6 months we will be at a very different place.
With the proper position sizing you could start scaling in 5-10% of your planned investment in Russell if you don't have any position already.
Risk reward potential is greater that it one day will retest any of the levels above.
There are some nice trades that can be made with this.

Market sell off in small cap stocks Market sell off in small cap stocks. Small cap stocks are usually the first to sell off and the last to rally bad times for the markets ahead?

Was this the final hurrah? Sell US EQTYFollowing on from the last post on here, (links below)
RUT, broke the range I mentioned 2150/2350 indicating the bull still held.
I said clues of how the RUT behaves at the range highs would be an indication of overall market strength
We are now there.
RUT broke highs- but HAS NOW FAILED to be convincing - (by closing back inside the range)
Even if you don't pay attention to volume (you should!), that chart pattern is the epitome of trading.
Add it to knowing when there is "lopsided positioning" you have a trading methodology .
Positioning data freely published is COT data, and it has "Asset Managers" as excessively long here,
ie "Smart money managers" are heavily positioned to one side (long)
=> so, any down moves, and they will be puking their positions and adding to downside movement...
(you get paid when other people are stopping out, panickedly hitting "Market Orders to close", forcing price in the direction you want)
Along with all the "market internals" I have banged on about before - all deteriorating....well....
it's all similar to when i last posted an idea with the same title

Market Pulse ed.11.11 DAY TRADING SYSTEM Sharing potential #trade setup and insights
How to make your account go green.
*Simple tools,
*Price
*Supply and Demand
*MAcd
*50Dma
*News
Using #Tradingview, amazing tool for tracking and charting...
Here is a link for free account:
www.tradingview.com
For my chart setup : www.tradingview.com
Disclaimer:
Not a Financial Advisor. Not recommendation to Buy or Sell.
#stocktrading #optiontrading #momentumtrader

Market Pulse ED.11.05, Today trade setups, raw and uneditedFollow up to Morning Brew setups:
Sharing potential #trade setup and insights
How to make your account go green.
*Simple tools,
*Price
*Supply and Demand
*MAcd
*50Dma
*News
Using #Tradingview, amazing tool for tracking and charting...
Here is a link for free account:
www.tradingview.com
For my chart setup : www.tradingview.com
Disclaimer:
Not a Financial Advisor. Not recommendation to Buy or Sell.
#stocktrading #optiontrading #momentumtrade

$RTY | UPDATEAlmost at the wave 3 target, upside limited in my opinion. Wait for the wave 4 dip. It will be a gift in the market.
Thank me later.

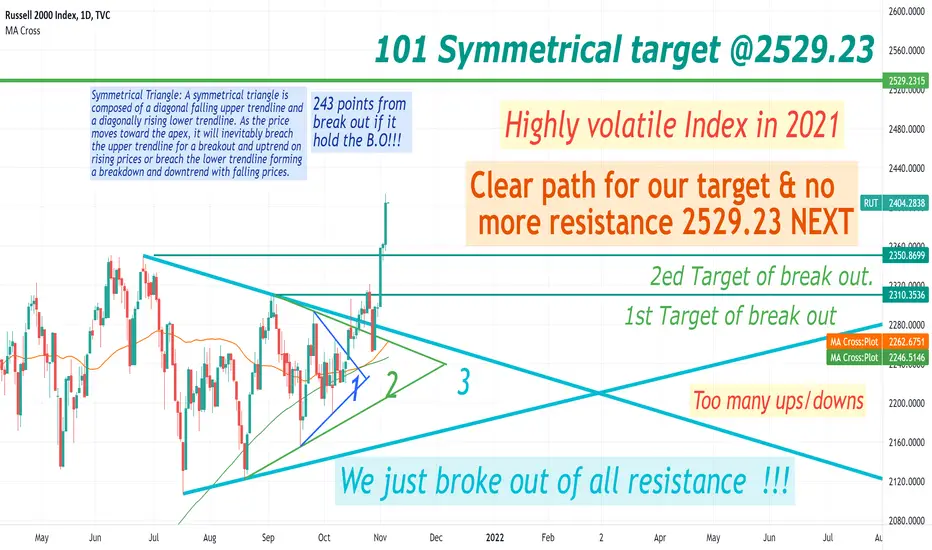
Hard to analyze W/ high volatility in 2021 !Symmetrical Triangle: A symmetrical triangle is
composed of a diagonal falling upper trendline and
a diagonally rising lower trendline. As the price
moves toward the apex, it will inevitably breach
the upper trendline for a breakout and uptrend on
rising prices or breach the lower trendline forming
a breakdown and downtrend with falling prices.
History repeatsFrom 1900
history always repeats.
learn history.
long explaination is not helpful.
wisdom is taken only by soul walkers
źzzzzzzzzzzzzzzzzzzzzzz
zzzzzzzzzzzzzzzzzzzzzzzz
