Today the russel was much stronger than the other marketsI am trying to find a valid entry method even if the hourly bar does not close above the POC.
On the Russel the reversal was clear, the new now was immediatly bought.
So entries on reversal area much better traded on the lower 5 min time frame anticipating a trade above the POC.
US2000 trade ideas

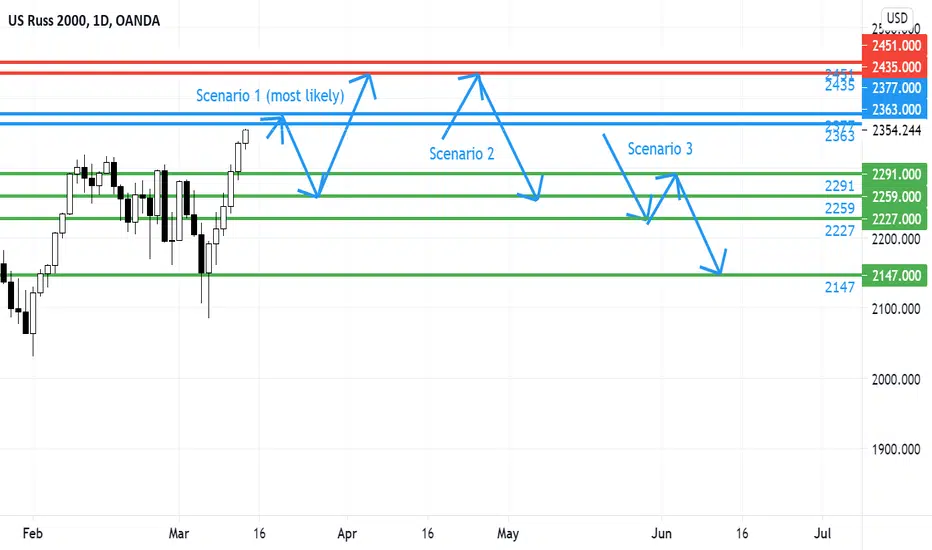
Weekly Analysis for #RUT for 15-19 March 2021Trend: Daily/Weekly/Monthly: Up/Up/Up
RUT is strongest of the 3 US indices. Expect rotation to continue and RUT to lead. I don’t and can’t call tops. But some signs point to pullbacks.
3 possible scenarios:
1) As long as 2363-77 resistance zone holds, look for shorts targeting 2259-91 support zone. This zone should hold for a next leg up, to 2435-51.
2) We have a fast rally from open to 2435-51 resistance zone, by Tuesday or Wednesday, where we see a sharp rejection for a strong move down to 2259-91.
3) We open in Globex and sell off start, targeting 2227 before a bounce to 2259-91 and further selling to 2147
IMO, scenario 1 is most likely.

RUSSELL 2000 is leading S&P 500The RUT/S&P 500 ratio’s monthly, weekly and daily charts are presented. ___
Prompt: New traders should take some time and carefully read the post entitled 'You can't beat the market' that is located in my profile.
Disclaimer
The author of this text is not an investment advisor. The preceding content is intended to be used for informational and educational purposes only.
It is not an advice or inducement for the purchase or sale of the products mentioned. Before making any investment based on your own personal circumstances,
it is very important to do your own research and analysis and also take independent financial advice from a professional to verify any information provided here.

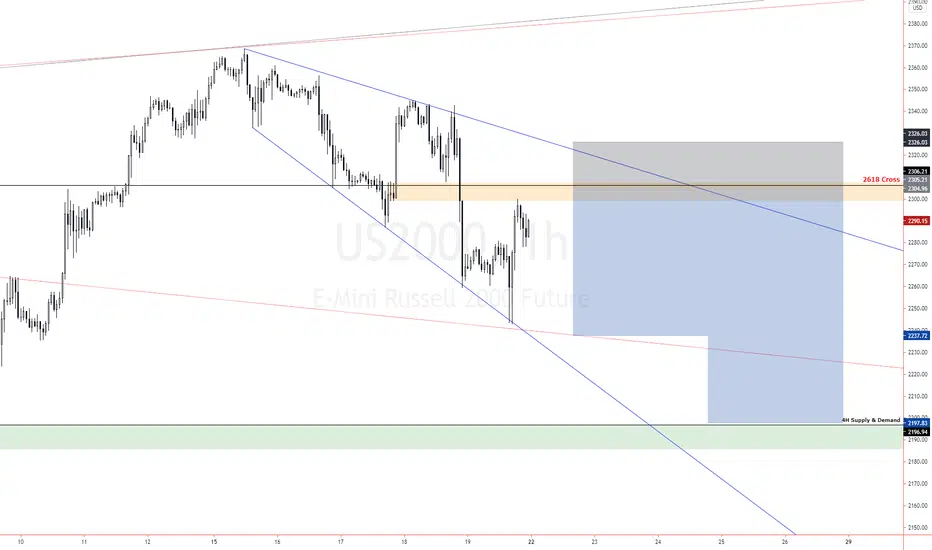
Swing Trade Russel, still long but trying to exit at double topEntered the daytraded above a green 1 hour bar above the POC line, exit not on a trailing stop but with limit order at the top of a large red 1 hour bar...

US200USD: RUSSELL 2000 updated COUNTShort-term = SHORT.
Mid-term = LONG.
This is my PERSONAL trading CHART, with no further educational explanations.
BUYING STRATEGY: Take 50% profit at 50% of previous WAVE (just do it) and place stop at purchase price.
IF price reverses lower YOUR EVEN,.... IF price continues UP-TREND then, re-buy at NEXT CORRECTIVE WAVE.
This is actually a very aggressive strategy for going in early that is why 50% "hedge" PROFIT is taken EARLY in the TRADE.
Combining ELLIOTT WAVE and THIS strategy , has SAVED my account 3-TMES during the past 3-weeks.

Russel bounced of prior support after NFPLooking forward to exit at prior POC and then either short or long depending on how price behaves on new POCs

Shoulder, head, shoulder formation Hi,
From the technical standpoint I noticed the SHS formation.
Be aware.
What do you think?
Please comment.

Its time to buyThe chart is formed falling wedge patthern.
I think it will be a strong bullish the next weeks.


Russell 2000 into New PeaksRussell 2000 is trading bullishly inside a huge channel. Moving into lower timeframes, price is above MA200, looking for buy setups.
If you like the idea, support us with a like and follow !
MacroForex

Russell 2000 hitting channel resistance plus bollinger bandsThis is nearing the end of the bull run. The coinciding successive bollinger band breaches to the upside on the monthly right at long term channel resistance spells one major leg down coming up shortly.

Should be another LONG entry on the russel on US market opensPullbacks / Breakouts on POC Level provide low risk entries...

US-MARKETS : CORECTION NEARNG COMPLETIONDuring CORRECTIONS it is inciteful to create a CHART, where YOU can watch ALL the INDICES at once.
This is my PERSONAL trading CHART, with no further educational explanations.
IF you get it, YOU GET IT, if you don't, YOU DON'T. I really don't care.
We use ELLIOTT WAVE theory to determine WHAT we are looking for, (i.e. TOP or BOTTOM). THEN technical MULTI-TIME-FRAME Indicator analysis
To fine-tune to what extent price will and when. Enter and exit TRADES in steps ... NEVER go all-in or all-out at ONCE.
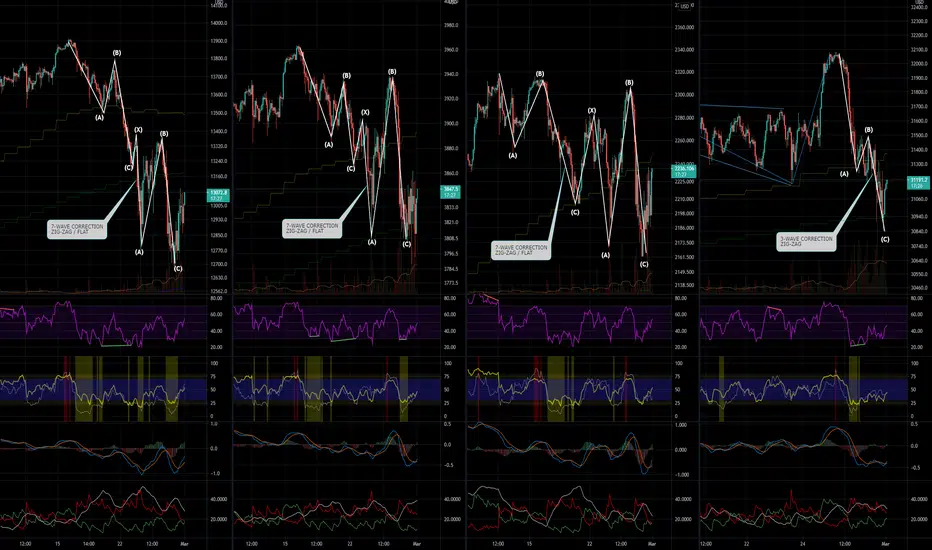
US-MARKET CORRECTION NEARLY COMPLETEDuring CORRECTIONS I find it useful to create a CHART, where YOU can watch ALL the INDICES at once.
This is my PERSONAL trading CHART, with no further educational explanations.
IF you get it, YOU GET IT, if you don't, YOU DON'T. I really don't care.
We use ELLIOTT WAVE theory to determine WHAT we are looking for, (i.e. TOP or BOTTOM). THEN technical MULTI-TIME-FRAME Indicator analysis
To fine-tune the expected move in terms of PRICE and TIMING. Enter and exit TRADES in steps ... NEVER go all-in or all-out at ONCE.


Trading scenarios for $RUT for 01-05 March 2021Trend:
Daily/Weekly/Monthly: Down/Mixed/Mixed
#RUT continues to be strongest of the 3 US indices, but Friday was disappointing.
3 possible scenarios:
1) Break of 2163, target 2097 and further 2044
2) As long as 2163 holds, look for longs, targeting 2289, which is a strong R. If we break this R, look for ATH at 2375.
3) 2163 holds and we target 2289. Rejection off 2289, for a move back to 2196.
IMO, scenario 3 is most likely.

Russel small cap 2000 short ideaRussel small cap 2000 moving upside in a paralell channel and now the price arrived to the Channel upper line at 2300 usd. I think it will go down to previously support/resistance at ~2200.
Trade at your own risk.
If you like my idea, dont forget to leave a comment, follow, and like.

US200USD: RUSSEL looks kinda BULLISH to me = LONGThe RUT corrective structure LOOKs soooo BULLISH, I just had to PUBLISH it.
LONG


RUT - LONG Can use R2K futures on this as well, may have a bit more downside potentially to 2200 but I am getting in here and giving it some room

SHORT price broke $2275This publish is meant for educational purposes only. This is not an investment device.
Added RUT Double diagonal... Will post trade details soon..
