Russel 2000 Compared to General MarketTVC:RUT has continued to sell off since my last couple posts and I believe we could see a huge market correction this year if price doesn't look to stop selling.
The next play on RUT I would like to see price pullback to the last breakout zone ($2,200) to confirm a continuation in trend
This play also looks very familiar to the 2022 selloff with equal highs to our current price structure. Seeing that AMEX:SPY is at a higher high tells me there is market-wide divergence and a topping pattern could be in play.
Now when we add CRYPTOCAP:BTC and $OTHER to the mix we can see bitcoin actually tops out first while Alts and SPX look to make one more leg up before crashing out.
The Trend Reader at the lower tab has topped out and has a bearish crossing in the overbought zone indicating we can see a long term play to the downside.
US2000 trade ideas

Russell2000 The Week Ahead 10th March '25Sentiment: Bearish INTRADAY, Price action is consolidating in a tight trading range.
Resistance: Key Resistance is at 2135, followed by 2175 and 2208.
Support: Key support is at 2020 followed by 2000 and 1900.
This communication is for informational purposes only and should not be viewed as any form of recommendation as to a particular course of action or as investment advice. It is not intended as an offer or solicitation for the purchase or sale of any financial instrument or as an official confirmation of any transaction. Opinions, estimates and assumptions expressed herein are made as of the date of this communication and are subject to change without notice. This communication has been prepared based upon information, including market prices, data and other information, believed to be reliable; however, Trade Nation does not warrant its completeness or accuracy. All market prices and market data contained in or attached to this communication are indicative and subject to change without notice.

The Russell 2000 is cornered🟢 The Russell 2000 is cornered
The American index Russell 2000 is at a crucial point for its future development.
The price is near the marked double top and is also using the 2024 upward trendline as support.
If the 2024 upward trendline is lost, the price could see drops of at least 7% in a few days.
If it breaks the double top , it means we have nothing to worry about, and the price will continue with the current upward trend, without the need for a sideways market that offers a pause for investors.
✅ What pattern is unfolding in TVC:RUT ?
It is showing a double top, which, if it breaks the $1600 area, would put the index in serious trouble. For now, we should focus on the blue trendline, as breaking and losing the $2,170 area would lead to corrections down to the next support, implying rapid drops of an additional 7%.
We should wait and buy at the trendline, and sell if it's broken. Always follow the money management strategy explained in all other ideas to create risk-free trades.
✴️ Do you want me to analyze any market? Just comment below which market you want!!
ENJOY AND FOLLOW for more 😊

Russell 2000 INTRADAY ahead of US Non Farm PayrollsSentiment: Neutral, Price action is consolidating in a tight trading range.
Resistance: Key Resistance is at 2100, followed by 2113 and 2123.
Support : Key support is at 2054 followed by 2035 and 2026.
This communication is for informational purposes only and should not be viewed as any form of recommendation as to a particular course of action or as investment advice. It is not intended as an offer or solicitation for the purchase or sale of any financial instrument or as an official confirmation of any transaction. Opinions, estimates and assumptions expressed herein are made as of the date of this communication and are subject to change without notice. This communication has been prepared based upon information, including market prices, data and other information, believed to be reliable; however, Trade Nation does not warrant its completeness or accuracy. All market prices and market data contained in or attached to this communication are indicative and subject to change without notice.

Russell 2000 H4 | Pullback resistance at 61.8% Fibo retracementRussell 2000 (US2000) is rising towards a pullback resistance and could potentially reverse off this level to drop lower.
Sell entry is at 2,133.07 which is a pullback resistance that aligns close to a 61.8% Fibonacci retracement.
Stop loss is at 2,202.00 which is a level that sits above the 50.0% Fibonacci retracement and a swing-high resistance.
Take profit is at 2,047.95 which is a swing-low support.
High Risk Investment Warning
Trading Forex/CFDs on margin carries a high level of risk and may not be suitable for all investors. Leverage can work against you.
Stratos Markets Limited (www.fxcm.com):
CFDs are complex instruments and come with a high risk of losing money rapidly due to leverage. 63% of retail investor accounts lose money when trading CFDs with this provider. You should consider whether you understand how CFDs work and whether you can afford to take the high risk of losing your money.
Stratos Europe Ltd (www.fxcm.com):
CFDs are complex instruments and come with a high risk of losing money rapidly due to leverage. 63% of retail investor accounts lose money when trading CFDs with this provider. You should consider whether you understand how CFDs work and whether you can afford to take the high risk of losing your money.
Stratos Trading Pty. Limited (www.fxcm.com):
Trading FX/CFDs carries significant risks. FXCM AU (AFSL 309763), please read the Financial Services Guide, Product Disclosure Statement, Target Market Determination and Terms of Business at www.fxcm.com
Stratos Global LLC (www.fxcm.com):
Losses can exceed deposits.
Please be advised that the information presented on TradingView is provided to FXCM (‘Company’, ‘we’) by a third-party provider (‘TFA Global Pte Ltd’). Please be reminded that you are solely responsible for the trading decisions on your account. There is a very high degree of risk involved in trading. Any information and/or content is intended entirely for research, educational and informational purposes only and does not constitute investment or consultation advice or investment strategy. The information is not tailored to the investment needs of any specific person and therefore does not involve a consideration of any of the investment objectives, financial situation or needs of any viewer that may receive it. Kindly also note that past performance is not a reliable indicator of future results. Actual results may differ materially from those anticipated in forward-looking or past performance statements. We assume no liability as to the accuracy or completeness of any of the information and/or content provided herein and the Company cannot be held responsible for any omission, mistake nor for any loss or damage including without limitation to any loss of profit which may arise from reliance on any information supplied by TFA Global Pte Ltd.
The speaker(s) is neither an employee, agent nor representative of FXCM and is therefore acting independently. The opinions given are their own, constitute general market commentary, and do not constitute the opinion or advice of FXCM or any form of personal or investment advice. FXCM neither endorses nor guarantees offerings of third party speakers, nor is FXCM responsible for the content, veracity or opinions of third-party speakers, presenters or participants.

Russell 2000 Very UndervaluedJust wanted to share this to help people keep calm during this tariff everything sell off. Small caps have been crushed well below their longterm trend. I'd suggest holding on for the rebound above resistance.
Russell 2000 Key levels ahead of US OpenBearish Scenario:
The Russell 2000 index remains in a shorter-term downtrend, signaling continued bearish momentum. The key resistance level to watch is 2208. If an oversold rally occurs but faces rejection at this level, the index could resume its decline, targeting 2078, followed by 2015 and the psychological 2000 level over a longer timeframe.
Bullish Scenario:
A confirmed breakout above 2208 and a daily close above this level would invalidate the bearish outlook. This could trigger further upside movement, with resistance targets at 2230, followed by 2278.
Conclusion:
The near-term sentiment remains bearish, with 2208 as the key pivot level. A rejection from this resistance would reinforce downside risks, while a breakout above it could indicate a shift toward renewed bullish momentum. Traders should closely monitor price action around this level to assess the next move.
This communication is for informational purposes only and should not be viewed as any form of recommendation as to a particular course of action or as investment advice. It is not intended as an offer or solicitation for the purchase or sale of any financial instrument or as an official confirmation of any transaction. Opinions, estimates and assumptions expressed herein are made as of the date of this communication and are subject to change without notice. This communication has been prepared based upon information, including market prices, data and other information, believed to be reliable; however, Trade Nation does not warrant its completeness or accuracy. All market prices and market data contained in or attached to this communication are indicative and subject to change without notice.

RUSSELL capped by 200DMA, The Week Ahead 03rd March '25The Russell 2000 (US2000) index exhibits bearish sentiment as the long-term uptrend is under threat, with price action closing below the psychologically significant 200-day moving average (2209). Since reaching an all-time high on November 25, 2024, the index has started to show weakness, suggesting a potential continuation of its corrective consolidation.
Bullish Scenario:
The 2209 level (200-day moving average) serves as a critical support zone.
A bullish rebound from this level could restore upward momentum.
Potential upside targets include:
2257 (initial resistance)
2324 (next major resistance)
2360 (longer-term target)
A strong bounce from 2209 could signal a recovery and reaffirm the broader uptrend, attracting renewed buying interest.
Bearish Scenario:
A confirmed break below 2141 support, followed by a daily close under this level, would indicate further weakness.
This could accelerate the downside momentum, leading to potential targets at:
2093 (next key support)
2023, if selling pressure intensifies
A sustained move below 2141 would invalidate the bullish outlook, suggesting the corrective phase could deepen, with the potential for an extended pullback.
Market Outlook:
The 2209 level remains the key pivot—holding above it could support a recovery, while a decisive break lower would confirm a deeper correction. Traders should monitor price action closely for confirmation signals to assess the next directional move in the market.
This communication is for informational purposes only and should not be viewed as any form of recommendation as to a particular course of action or as investment advice. It is not intended as an offer or solicitation for the purchase or sale of any financial instrument or as an official confirmation of any transaction. Opinions, estimates and assumptions expressed herein are made as of the date of this communication and are subject to change without notice. This communication has been prepared based upon information, including market prices, data and other information, believed to be reliable; however, Trade Nation does not warrant its completeness or accuracy. All market prices and market data contained in or attached to this communication are indicative and subject to change without notice.

RUT - Russle signals a drop to 1900ishThe white Pitchfork was guiding us to the Center-Line. As so often, price is turning at this level, just to reach the opposite side.
It's the same game every time.
Just follow the rules, apply a good risk and money management.
The down-sloping red Fork projects the current most probably path of price to the downside. And of course our profit target, which is the red Center-Line.
The signal is the break, the close below the shelf, the tiny support, marked by the petrol horizontal line.
Trade wisely, trade without attaching your emotions. It just is what it is, whatever the outcome will be. Knowing this, you can embrace inner freedom in trading.

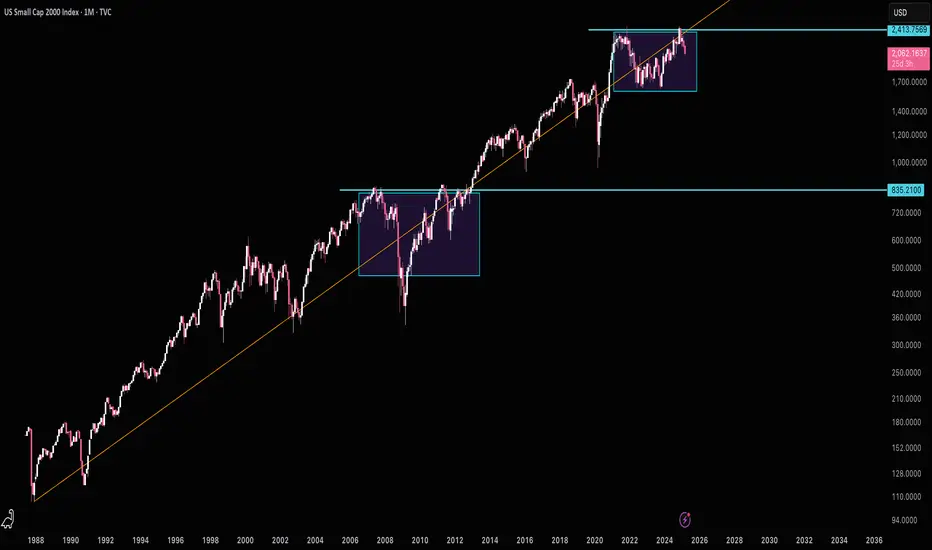
RUSSELL: Targeting at least 3,000 end of yearRussell 200 may be almost neutral on its 1D technical outlook (RSI = 34.476, MACD = -14.090, ADX = 24.893) but still neutral on 1W as the 1W MA50 continues to hold since November 2023. The price action is exactly around the middle of the 16 year Channel Up and since the September 2022 low, we've been on the new Bull Cycle / bullish wave. The Cycles are repetitive and so far in these 16 years we've had another three similar phases of growth. The 1W RSI indicates that the current will top near the end of 2025. All prior have reached at least the 2.0 Fibonacci extension but since the pace of the current Bull Cycle has slowed down, a TP = 3,000 will be much more suited as the target of this Cycle.
## If you like our free content follow our profile to get more daily ideas. ##
## Comments and likes are greatly appreciated. ##

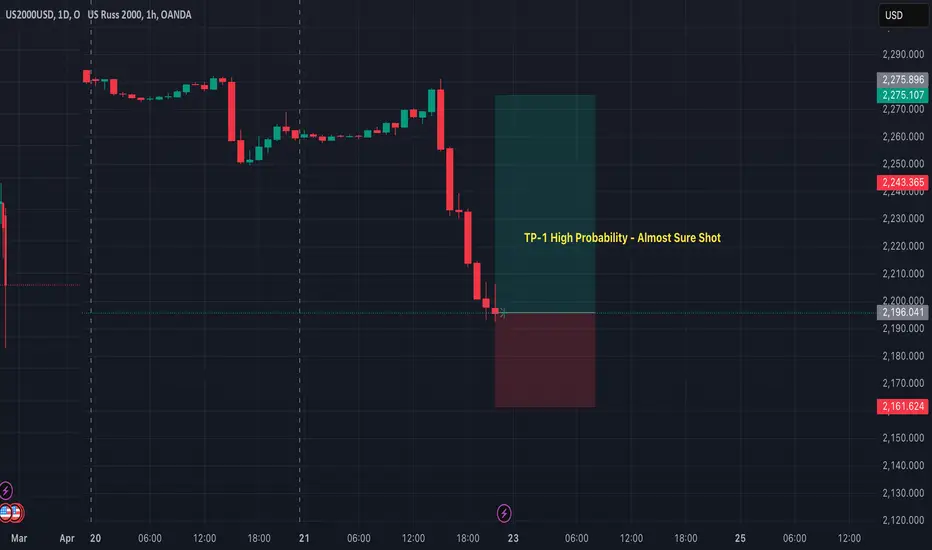
Long - High Probability TP-1, Use Smart Risk Mangmnt: EasyMoneyLong.
TP-1 will hit forsure, if you want to play full safer than take a little broader SL with proper risk management so you don't get out by lower wick, rest is fine: easy money sitting at TP-1 level.
Use proper risk management
Looks like good trade.
Lets monitor.
Use proper risk management.
Disclaimer: only idea, not advice.
RUSSELL200 below 200 DMA after Friday correction The Russell2000 (US2000) index price action sentiment appears neutral, the longer-term prevailing uptrend is challenged as the price closed below the psychologically important 200-day moving average. Since reaching an all-time high on 25th November 2024 the Russell2000 index price action is consolidating in a sideways trading range.
The key trading level is at 2207, which is the 200-day moving average level. A bullish bounce back from the 2207 level could target the upside resistance at 2257 followed by the 2324 and 2360 levels over the longer timeframe.
Alternatively, a confirmed loss of 2207 support and another daily close below that level would negate the bullish outlook opening the way for a further retracement and a retest of 2140 support level followed by 2093.
This communication is for informational purposes only and should not be viewed as any form of recommendation as to a particular course of action or as investment advice. It is not intended as an offer or solicitation for the purchase or sale of any financial instrument or as an official confirmation of any transaction. Opinions, estimates and assumptions expressed herein are made as of the date of this communication and are subject to change without notice. This communication has been prepared based upon information, including market prices, data and other information, believed to be reliable; however, Trade Nation does not warrant its completeness or accuracy. All market prices and market data contained in or attached to this communication are indicative and subject to change without notice.

RUSSELL 2000 failed breakout and consolidation We are back in this blog space after a couple of days holiday. The RUSSELL 2000 ETF AMEX:IWM failed at the same price point which it failed back in Nov 2021. It seems Price having a memory. It failed at the same price it failed in Nov 2021. After it failed from the top on 16th Dec 2024 it has recently retraced back to the 0.236 Fib retracement level @ 2237. It has been consolidating at that level and if it breaks down then the next support is @ 2167 .
Before the AMEX:IWM breaks out form this pattern it has to complete the wedge forming consolidating pattern. In my opinion the direction will be decided by the TVC:US10Y . As long as the TVC:US10Y stays below 4.5% the AMEX:IWM can consolidate here and then my break upwards as long as the bull market remains intact.
Direction of AMEX:IWM will be determined by TVC:US10Y

RUSSELL 15-year Cycles holding perfectlyIt has been 6 months ago (August 15, see chart below) when we updated our long-term call on Russell 2000 (RUT) based on a 15-year Cyclical pattern:
As you can see, since we introduced this long-term commitment on Russell back on October 07 2023, the index made a remarkable recovery and now the final step is to break above the previous All Time High (ATH) and turn it into the long-term Support.
That is what happened on all 3 of its previous Cycles (only broken temporarily during the COVID flash crash). As long as the 1M MA50 (blue trend-line) holds, we expect the pattern to hold once more and fulfil the 2.0 Fibonacci extension condition as the near Cycle Top. Our long-term Target remains 3500.
-------------------------------------------------------------------------------
** Please LIKE 👍, FOLLOW ✅, SHARE 🙌 and COMMENT ✍ if you enjoy this idea! Also share your ideas and charts in the comments section below! This is best way to keep it relevant, support us, keep the content here free and allow the idea to reach as many people as possible. **
-------------------------------------------------------------------------------
💸💸💸💸💸💸
👇 👇 👇 👇 👇 👇

RUSSELL200 uptrend pauseThe Russell2000 (US2000) index price action sentiment appears bullish, supported by the longer-term prevailing uptrend. However, since reaching an all-time high on 25th November 2024 the Russell2000 index price action is consolidating in a sideways trading range.
The key trading level is at 2236, which is the current swing low. A corrective pullback from the current levels and a bullish bounce back from the 2236 level could target the upside resistance at 2310 followed by the 2323 and 2340 levels over the longer timeframe.
Alternatively, a confirmed loss of 2236 support and a daily close below that level would negate the bullish outlook opening the way for a further retracement and a retest of 2220 support level followed by 2196 and 2160.
This communication is for informational purposes only and should not be viewed as any form of recommendation as to a particular course of action or as investment advice. It is not intended as an offer or solicitation for the purchase or sale of any financial instrument or as an official confirmation of any transaction. Opinions, estimates and assumptions expressed herein are made as of the date of this communication and are subject to change without notice. This communication has been prepared based upon information, including market prices, data and other information, believed to be reliable; however, Trade Nation does not warrant its completeness or accuracy. All market prices and market data contained in or attached to this communication are indicative and subject to change without notice.

RUSS200 (US2000) outlook The Russell2000 (US2000) index price action sentiment appears bullish, supported by the longer-term prevailing uptrend. However, since reaching an all-time high on 25th November 2024 the Russell2000 index price action is consolidating in a sideways trading range.
The key trading level is at 2236, which is the current swing low. A corrective pullback from the current levels and a bullish bounce back from the 2236 level could target the upside resistance at 2310 followed by the 2323 and 2340 levels over the longer timeframe.
Alternatively, a confirmed loss of 2236 support and a daily close below that level would negate the bullish outlook opening the way for a further retracement and a retest of 2222 support level followed by 2196.
This communication is for informational purposes only and should not be viewed as any form of recommendation as to a particular course of action or as investment advice. It is not intended as an offer or solicitation for the purchase or sale of any financial instrument or as an official confirmation of any transaction. Opinions, estimates and assumptions expressed herein are made as of the date of this communication and are subject to change without notice. This communication has been prepared based upon information, including market prices, data and other information, believed to be reliable; however, Trade Nation does not warrant its completeness or accuracy. All market prices and market data contained in or attached to this communication are indicative and subject to change without notice.

US2000 sideways consolidation continuesThe Russell2000 (US2000) index price action sentiment appears bullish, supported by the longer-term prevailing uptrend. However, since reaching an all-time high on 25th November 2024 the Russell2000 index price action is consolidating in a sideways trading range.
The key trading level is at 2195, which is the current swing low. A corrective pullback from the current levels and a bullish bounce back from the 2195 level could target the upside resistance at 2267 followed by the 2323 and 2340 levels over the longer timeframe.
Alternatively, a confirmed loss of 2195 support and a daily close below that level would negate the bullish outlook opening the way for a further retracement and a retest of 2163 support level followed by 2136.
This communication is for informational purposes only and should not be viewed as any form of recommendation as to a particular course of action or as investment advice. It is not intended as an offer or solicitation for the purchase or sale of any financial instrument or as an official confirmation of any transaction. Opinions, estimates and assumptions expressed herein are made as of the date of this communication and are subject to change without notice. This communication has been prepared based upon information, including market prices, data and other information, believed to be reliable; however, Trade Nation does not warrant its completeness or accuracy. All market prices and market data contained in or attached to this communication are indicative and subject to change without notice.

Russell 2000 oversold bouncebackThe Russell2000 (US2000) index price action sentiment appears bullish, supported by the longer-term prevailing uptrend. However, since reaching an all-time high on 25th November 2024 the Russell2000 index price action is consolidating in a sideways trading range.
The key trading level is at 2195, which is the current swing low. A corrective pullback from the current levels and a bullish bounce back from the 2195 level could target the upside resistance at 2267 followed by the 2323 and 2340 levels over the longer timeframe.
Alternatively, a confirmed loss of 2195 support and a daily close below that level would negate the bullish outlook opening the way for a further retracement and a retest of 2163 support level followed by 2136.
This communication is for informational purposes only and should not be viewed as any form of recommendation as to a particular course of action or as investment advice. It is not intended as an offer or solicitation for the purchase or sale of any financial instrument or as an official confirmation of any transaction. Opinions, estimates and assumptions expressed herein are made as of the date of this communication and are subject to change without notice. This communication has been prepared based upon information, including market prices, data and other information, believed to be reliable; however, Trade Nation does not warrant its completeness or accuracy. All market prices and market data contained in or attached to this communication are indicative and subject to change without notice.

Russell 2000 H4 | Potential bearish reversalRussell 2000 (US2000) is rising towards a swing-high resistance and could potentially reverse off this level to drop lower.
Sell entry is at 2,295.27 which is a swing-high resistance that aligns with the 50.0% Fibonacci retracement level.
Stop loss is at 2,325.00 which is a level that sits above the 78.6% Fibonacci retracement and a swing-high resistance.
Take profit is at 2,244.83 which is a swing-low support that aligns close to the 61.8% Fibonacci retracement level.
High Risk Investment Warning
Trading Forex/CFDs on margin carries a high level of risk and may not be suitable for all investors. Leverage can work against you.
Stratos Markets Limited (www.fxcm.com):
CFDs are complex instruments and come with a high risk of losing money rapidly due to leverage. 63% of retail investor accounts lose money when trading CFDs with this provider. You should consider whether you understand how CFDs work and whether you can afford to take the high risk of losing your money.
Stratos Europe Ltd (www.fxcm.com):
CFDs are complex instruments and come with a high risk of losing money rapidly due to leverage. 63% of retail investor accounts lose money when trading CFDs with this provider. You should consider whether you understand how CFDs work and whether you can afford to take the high risk of losing your money.
Stratos Trading Pty. Limited (www.fxcm.com):
Trading FX/CFDs carries significant risks. FXCM AU (AFSL 309763), please read the Financial Services Guide, Product Disclosure Statement, Target Market Determination and Terms of Business at www.fxcm.com
Stratos Global LLC (www.fxcm.com):
Losses can exceed deposits.
Please be advised that the information presented on TradingView is provided to FXCM (‘Company’, ‘we’) by a third-party provider (‘TFA Global Pte Ltd’). Please be reminded that you are solely responsible for the trading decisions on your account. There is a very high degree of risk involved in trading. Any information and/or content is intended entirely for research, educational and informational purposes only and does not constitute investment or consultation advice or investment strategy. The information is not tailored to the investment needs of any specific person and therefore does not involve a consideration of any of the investment objectives, financial situation or needs of any viewer that may receive it. Kindly also note that past performance is not a reliable indicator of future results. Actual results may differ materially from those anticipated in forward-looking or past performance statements. We assume no liability as to the accuracy or completeness of any of the information and/or content provided herein and the Company cannot be held responsible for any omission, mistake nor for any loss or damage including without limitation to any loss of profit which may arise from reliance on any information supplied by TFA Global Pte Ltd.
The speaker(s) is neither an employee, agent nor representative of FXCM and is therefore acting independently. The opinions given are their own, constitute general market commentary, and do not constitute the opinion or advice of FXCM or any form of personal or investment advice. FXCM neither endorses nor guarantees offerings of third-party speakers, nor is FXCM responsible for the content, veracity or opinions of third-party speakers, presenters or participants.

Russell 2000 H4 | Potential bearish reversalRussell 2000 (US2000) is rising towards a multi-swing-high resistance and could potentially reverse off this level to drop lower.
Sell entry is at 2,321.96 which is a multi-swing-high resistance.
Stop loss is at 2,382.00 which is a level that sits above the 127.2% Fibonacci extension level and a pullback resistance.
Take profit is at 2,256.42 which is a swing-low support that aligns with the 50.0% Fibonacci retracement level.
High Risk Investment Warning
Trading Forex/CFDs on margin carries a high level of risk and may not be suitable for all investors. Leverage can work against you.
Stratos Markets Limited (www.fxcm.com):
CFDs are complex instruments and come with a high risk of losing money rapidly due to leverage. 63% of retail investor accounts lose money when trading CFDs with this provider. You should consider whether you understand how CFDs work and whether you can afford to take the high risk of losing your money.
Stratos Europe Ltd (www.fxcm.com):
CFDs are complex instruments and come with a high risk of losing money rapidly due to leverage. 63% of retail investor accounts lose money when trading CFDs with this provider. You should consider whether you understand how CFDs work and whether you can afford to take the high risk of losing your money.
Stratos Trading Pty. Limited (www.fxcm.com):
Trading FX/CFDs carries significant risks. FXCM AU (AFSL 309763), please read the Financial Services Guide, Product Disclosure Statement, Target Market Determination and Terms of Business at www.fxcm.com
Stratos Global LLC (www.fxcm.com):
Losses can exceed deposits.
Please be advised that the information presented on TradingView is provided to FXCM (‘Company’, ‘we’) by a third-party provider (‘TFA Global Pte Ltd’). Please be reminded that you are solely responsible for the trading decisions on your account. There is a very high degree of risk involved in trading. Any information and/or content is intended entirely for research, educational and informational purposes only and does not constitute investment or consultation advice or investment strategy. The information is not tailored to the investment needs of any specific person and therefore does not involve a consideration of any of the investment objectives, financial situation or needs of any viewer that may receive it. Kindly also note that past performance is not a reliable indicator of future results. Actual results may differ materially from those anticipated in forward-looking or past performance statements. We assume no liability as to the accuracy or completeness of any of the information and/or content provided herein and the Company cannot be held responsible for any omission, mistake nor for any loss or damage including without limitation to any loss of profit which may arise from reliance on any information supplied by TFA Global Pte Ltd.
The speaker(s) is neither an employee, agent nor representative of FXCM and is therefore acting independently. The opinions given are their own, constitute general market commentary, and do not constitute the opinion or advice of FXCM or any form of personal or investment advice. FXCM neither endorses nor guarantees offerings of third-party speakers, nor is FXCM responsible for the content, veracity or opinions of third-party speakers, presenters or participants.

US2000 / Russell2000 "US Small Cap" Indices Market Heist Plan🌟Hi! Hola! Ola! Bonjour! Hallo!🌟
Dear Money Makers & Thieves, 🤑 💰🐱👤
Based on 🔥Thief Trading style technical and fundamental analysis🔥, here is our master plan to heist the US2000 / Russell 2000 "US Small Cap" Indices market. Please adhere to the strategy I've outlined in the chart, which emphasizes long entry. Our aim is the high-risk Red Zone. Risky level, overbought market, consolidation, trend reversal, trap at the level where traders and bearish robbers are stronger. 🏆💸Be wealthy and safe trade.💪🏆🎉
Entry 📈 : "The heist is on! Wait for the breakout (2300.00) then make your move - Bullish profits await!"
however I advise placing Buy Stop Orders above the breakout MA or Place Buy limit orders within a 15 or 30 minute timeframe. Entry from the most recent or closest low or high level should be in retest.
Stop Loss 🛑: Thief SL placed at 2250.00 (swing Trade) Using the 2H period, the recent / nearest low level.
SL is based on your risk of the trade, lot size and how many multiple orders you have to take.
Target 🎯: 2420.00 (or) Escape Before the Target
Scalpers, take note 👀 : only scalp on the Long side. If you have a lot of money, you can go straight away; if not, you can join swing traders and carry out the robbery plan. Use trailing SL to safeguard your money 💰.
📰🗞️Fundamental, Macro, COT, Sentimental Outlook:
The US2000 / Russell2000 "US Small Cap" Indices is expected to trend bullish in the short term, driven by strong earnings growth and a low interest rate environment.
🔰 Fundamental Analysis
- Earnings Growth: The US2000 index is expected to report strong earnings growth, with a forecast of 10% for the next quarter
- Revenue Growth: The US2000 index is expected to report strong revenue growth, with a forecast of 5% for the next quarter
- Valuation: The price-to-earnings (P/E) ratio of the US2000 index is currently 21.2, which is slightly above its historical average
🔰 Macro Analysis
- GDP Growth: The US GDP growth rate is expected to remain strong, with a forecast of 2.5% for the next quarter
- Inflation: The US inflation rate is expected to remain low, with a forecast of 2.2% for the next quarter
- Interest Rates: The Federal Reserve is expected to keep interest rates low, with a forecast of no rate hikes for the next quarter
🔰 Sentimental Analysis
- Bullish Sentiment: 60% of traders are bullish on the US2000 index, indicating a strong uptrend
- Bearish Sentiment: 30% of traders are bearish on the US2000 index, indicating a potential correction
- Neutral Sentiment: 10% of traders are neutral on the US2000 index, indicating a balanced market
🔰 COT Analysis
- Institutional Traders: Institutional traders are net long the US2000 index, with a positioning score of 60
- Retail Traders: Retail traders are net short the US2000 index, with a positioning score of 40
🔰 Positioning
- Long Positions: Institutional traders are holding long positions in the US2000 index, indicating a bullish sentiment
- Short Positions: Retail traders are holding short positions in the US2000 index, indicating a bearish sentiment
🔰 Overall, the US2000 / Russell2000 "US Small Cap" Indices is expected to trend bullish in the short term, driven by strong earnings growth and a low interest rate environment. However, retail traders are holding short positions, indicating a potential correction.
⚠️Trading Alert : News Releases and Position Management 📰 🗞️ 🚫🚏
As a reminder, news releases can have a significant impact on market prices and volatility. To minimize potential losses and protect your running positions,
we recommend the following:
Avoid taking new trades during news releases
Use trailing stop-loss orders to protect your running positions and lock in profits
📌Please note that this is a general analysis and not personalized investment advice. It's essential to consider your own risk tolerance and market analysis before making any investment decisions.
📌Keep in mind that these factors can change rapidly, and it's essential to stay up-to-date with market developments and adjust your analysis accordingly.
💖Supporting our robbery plan will enable us to effortlessly make and steal money 💰💵 Tell your friends, Colleagues and family to follow, like, and share. Boost the strength of our robbery team. Every day in this market make money with ease by using the Thief Trading Style.🏆💪🤝❤️🎉🚀
I'll see you soon with another heist plan, so stay tuned 🤑🐱👤🤗🤩

US2000 "US Small Cap" Indices Market Heist Plan🌟Hi! Hola! Ola! Bonjour! Hallo!🌟
Dear Money Makers & Robbers, 🤑 💰
Based on 🔥Thief Trading style technical and fundamental analysis🔥, here is our master plan to heist the US2000 "US Small Cap" Indices Market. Please adhere to the strategy I've outlined in the chart, which emphasizes short entry. Our aim is the high-risk Green Zone. Risky level, oversold market, consolidation, trend reversal, trap at the level where traders and bullish robbers are stronger. 🏆💸Be wealthy and safe trade.💪🏆🎉
Entry 📈 : "The vault is wide open! Swipe the Bullish loot at any price - the heist is on!
however I advise placing Sell limit orders within a 15 or 30 minute timeframe. Entry from the most recent or closest high or low level should be in retest.
Stop Loss 🛑: Thief SL placed at 2300.00 (swing Trade) Using the 4H period, the recent / nearest low or high level.
SL is based on your risk of the trade, lot size and how many multiple orders you have to take.
Target 🎯: 21500.00 (or) Escape Before the Target
Scalpers, take note 👀 : only scalp on the Short side. If you have a lot of money, you can go straight away; if not, you can join swing traders and carry out the robbery plan. Use trailing SL to safeguard your money 💰.
📰🗞️Fundamental, Macro, COT, Sentimental Outlook:
US2000 "US Small Cap" Indices Market is currently experiencing a Bearish trend., driven by several key factors.
🔱Fundamental Data
- Earnings Growth: 8% (last quarter)
- Dividend Yield: 1.7%
- Valuation: P/E Ratio 21.2 (slightly above historical average)
- Revenue Growth: 6% (last quarter)
🔱Macroeconomic Data
- Interest Rates: Federal Reserve kept interest rates steady at 4.25%-4.5%
- Inflation: Consumer Price Index (CPI) increased by 2.1% (last month)
- GDP Growth: US GDP growth rate expected to slow down to 1.8% in 2023
- Unemployment Rate: 3.4% (last month)
🔱COT Data
- Non-Commercial Traders: Net short 25,019 contracts (increase of 5,011 contracts from last week)
- Commercial Traders: Net long 20,011 contracts (decrease of 2,011 contracts from last week)
- Non-Reportable Positions: Net short 10,011 contracts (increase of 2,011 contracts from last week)
🔱Institutional Sentiment
- Goldman Sachs: Net short 18,011 contracts
- Morgan Stanley: Net short 12,011 contracts
- JPMorgan Chase: Net short 10,011 contracts
🔱Retail Sentiment
- Interactive Brokers: Net long 8,011 contracts
- TD Ameritrade: Net long 5,011 contracts
- E*TRADE: Net long 3,011 contracts
🔱Hedge Fund Sentiment
- Bridgewater Associates: Net short 20,011 contracts
- BlackRock: Net short 15,011 contracts
- Vanguard: Net short 10,011 contracts
🔱 Market Sentiment
- Bullish Traders: 42%
- Bearish Traders: 48%
- Neutral Traders: 10%
⚠️Trading Alert : News Releases and Position Management 📰 🗞️ 🚫🚏
As a reminder, news releases can have a significant impact on market prices and volatility. To minimize potential losses and protect your running positions,
we recommend the following:
Avoid taking new trades during news releases
Use trailing stop-loss orders to protect your running positions and lock in profits
📌Please note that this is a general analysis and not personalized investment advice. It's essential to consider your own risk tolerance and market analysis before making any investment decisions.
📌Keep in mind that these factors can change rapidly, and it's essential to stay up-to-date with market developments and adjust your analysis accordingly.
💖Supporting our robbery plan will enable us to effortlessly make and steal money 💰💵 Tell your friends, Colleagues and family to follow, like, and share. Boost the strength of our robbery team. Every day in this market make money with ease by using the Thief Trading Style.🏆💪🤝❤️🎉🚀
I'll see you soon with another heist plan, so stay tuned 🤗

"US2000 / Russell / US Small cap" CFD Index Market Heist Plan🌟Hi! Hola! Ola! Bonjour! Hallo!🌟
Dear Money Makers & Robbers, 🤑 💰
Based on 🔥Thief Trading style technical and fundamental analysis🔥, here is our master plan to heist the "US2000 / Russell / US Small cap" CFD Index Market. Please adhere to the strategy I've outlined in the chart, which emphasizes long entry. Our aim is the high-risk Red Zone. Risky level, overbought market, consolidation, trend reversal, trap at the level where traders and bearish robbers are stronger. Be wealthy and safe trade.💪🏆🎉
Entry 📈 : "The heist is on! Wait for the breakout (2320.0) then make your move - Bullish profits await!"
however I advise placing Buy limit orders within a 15 or 30 minute timeframe. Entry from the most recent or closest low or high level should be in retest.
Stop Loss 🛑: Using the 2H period, the recent / nearest low or high level.
Goal 🎯: 2430.0 (or) Escape Before the Target
Scalpers, take note 👀 : only scalp on the Long side. If you have a lot of money, you can go straight away; if not, you can join swing traders and carry out the robbery plan. Use trailing SL to safeguard your money 💰.
📰🗞️Fundamental, Macro, COT, Sentimental Outlook:
The US2000 indices are currently experiencing a mix of trends. Here's a breakdown of the current market situation:
🔴Fundamental Analysis
The Russell 2000 index, which measures the performance of approximately 2,000 small-cap companies in the US, is influenced by various fundamental factors, including economic indicators, interest rates, corporate earnings, and market sentiment.
🔵Macro Economics
The US economy is expected to experience a slowdown in growth, which could impact small-cap companies. However, the Federal Reserve's decision to keep interest rates low could support economic growth and benefit small-cap stocks.
🟠COT Analysis
The Commitment of Traders (COT) report shows that institutional traders are net long the Russell 2000 index, indicating a bullish sentiment. However, retail traders are net short, indicating a bearish sentiment.
⚪Sentimental Analysis
Market sentiment for the Russell 2000 index is currently neutral, with a sentiment score of 50. The index has experienced a significant rally in recent months, and some investors may be taking profits, leading to a neutral sentiment.
🟡Institutional Trader Positioning
Institutional traders are net long the Russell 2000 index, with a positioning score of 60. This indicates that institutional traders are bullish on the index and expect it to continue rising.
Institutional Traders
- Bullish: 62% of institutional traders are holding long positions, indicating a bullish sentiment.
- Bearish: 38% of institutional traders are holding short positions.
🟢Retail Trader Positioning
Retail traders are net short the Russell 2000 index, with a positioning score of 40. This indicates that retail traders are bearish on the index and expect it to fall.
Retail Traders
- Bullish: 42% of retail traders are holding long positions, indicating a slightly bearish sentiment.
- Bearish: 58% of retail traders are holding short positions.
Please note that these percentages are approximate and based on general market sentiment. They should not be taken as investment advice.
⚠️Trading Alert : News Releases and Position Management 📰 🗞️ 🚫🚏
As a reminder, news releases can have a significant impact on market prices and volatility. To minimize potential losses and protect your running positions,
we recommend the following:
Avoid taking new trades during news releases
Use trailing stop-loss orders to protect your running positions and lock in profits
📌Please note that this is a general analysis and not personalized investment advice. It's essential to consider your own risk tolerance and market analysis before making any investment decisions.
📌Keep in mind that these factors can change rapidly, and it's essential to stay up-to-date with market developments and adjust your analysis accordingly.
💖Supporting our robbery plan will enable us to effortlessly make and steal money 💰💵 Tell your friends, Colleagues and family to follow, like, and share. Boost the strength of our robbery team. Every day in this market make money with ease by using the Thief Trading Style.🏆💪🤝❤️🎉🚀
I'll see you soon with another heist plan, so stay tuned 🫂
