US2000 / RUSSELL2000 Market Money Heist Plan on Bearish SideHallo My Dear Robbers / Money Makers & Losers, 🤑💰
This is our master plan to Heist US2000 / RUSSELL 2000 Market based on Thief Trading style Technical Analysis.. kindly please follow the plan I have mentioned in the chart focus on Short entry. Our target is Green Zone that is High risk Dangerous level, market is oversold / Consolidation / Trend Reversal / Trap at the level Bullish Robbers / Traders gain the strength. Be safe and be careful and Be rich 💰.
Entry : Can be taken Anywhere, What I suggest you to Place Sell Limit Orders in 15mins Timeframe Recent / Nearest Swing High
Stop Loss 🛑: Recent Swing High using 2h timeframe
Attention for Scalpers : If you've got a lot of money you can get out right away otherwise you can join with a swing trade robbers and continue the heist plan, Use Trailing SL to protect our money 💰.
Note: If you've got a lot of money you can get out right away otherwise you can join with a swing trade robbers and continue the heist plan, Use Trailing SL to protect our money 💰.
Warning : Fundamental Analysis news 📰 🗞️ comes against our robbery plan. our plan will be ruined smash the Stop Loss. Don't Enter the market at the news update.
Loot and escape on the target 🎯 Swing Traders Plz Book the partial sum of money and wait for next breakout of dynamic level / Order block, Once it is cleared we can continue our heist plan to next new target.
Support our Robbery plan we can easily make money & take money 💰💵 Follow, Like & Share with your friends and Lovers. Make our Robbery Team Very Strong Join Ur hands with US. Loot Everything in this market everyday make money easily with Thief Trading Style.
Stay tuned with me and see you again with another Heist Plan..... 🫂
US2000 trade ideas

RUSSELL 2000 Set to RunThe Russell 2000 has been fighting to get through the POC, but with both the Stochastic RSI and CMF resetting a major move is possible. If the Russell can break through the selling pressure between 2220 and 2250, then we could see significant upside over the following weeks.

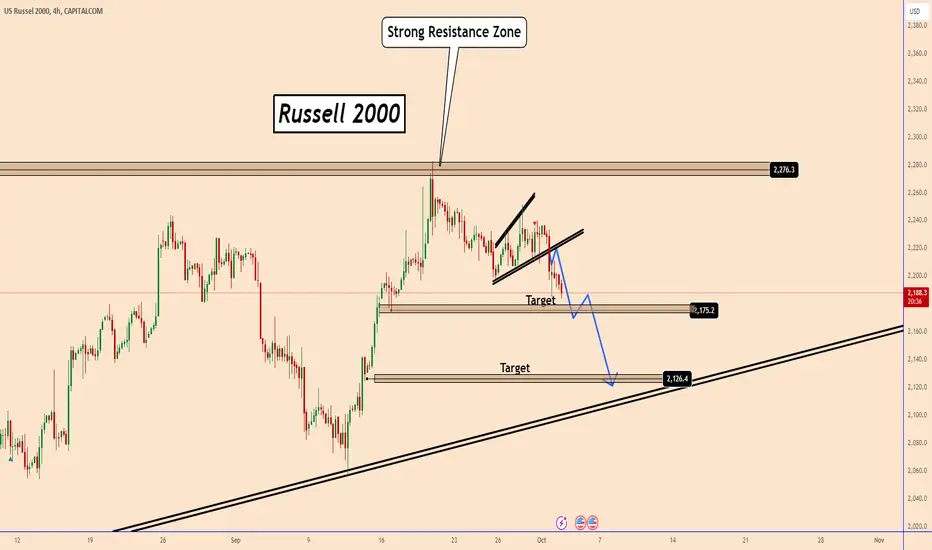
Russell 2000 Moved as ExpectedRussell 2000 Moved as Expected
In our previous analysis, we identified a corrective pattern in the Russell 2000, indicating a potential downward movement.
Yesterday, a significant catalyst impacted the markets:
Iran’s attack on Israel. This event provided the impetus for the Russell 2000 to begin its anticipated decline.
The price is now approaching the first target and is likely to reach the second target near 2126 within this week.
You may find more details in the chart!
Thank you and Good Luck!
❤️PS: Please support with a like or comment if you find this analysis useful for your trading day❤️
Previous Video Analysis:
Sell to buy tradeThe index seems like it's consolidating and is headed to find support on the lower barrier.

Sell to buy tradeThe index seems like it's consolidating and is headed to find support on the lower barrier.

Russell 2000: Multi-Time Frame AnalysisRussell 2000: Multi-Time Frame Analysis
The price recently tested a key resistance zone near 2280, but it appears to lack the strength to break above this level.
On the 4-hour chart, a small bearish pattern is also emerging.
If the price moves down a bit more, it could confirm a further decline.
You may watch the video for further details.
Thank you and Good Luck!

RUSSEL 2000 to 4K by Year End?The Russel is in a long-term up-trending channel and is flirting with a break above the midline. It has some major resistance to get through, but if it can break above the midline of the channel, we may be looking at 4K by EOY or Q1 at the latest.

Russell 2000 Gearing Up for a Breakout at Structural ResistanceThe Russell 2000 is closing in on the upper boundary of its structural zone around the 2276 mark, with bullish momentum pushing broader indices toward record levels. This wave of optimism could also lift the Russell 2000 to new heights.
On the daily chart, the index is once again approaching the critical 2276 level. In shorter time frames, fresh bullish formations are emerging, hinting at the potential for continued upward momentum.
Should the price break past the 2240 threshold, the chances of further upside grow significantly. A decisive move above this zone would likely drive the Russell 2000 higher, opening the door for more gains.
Wait for the breakout to come for the trade to be active.
Traders, if you found this idea helpful or have your own insights to share, feel free to drop a comment. I’d love to hear your thoughts!

Russell 2000 Poised to Test The Top of The StructureRussell 2000 Poised to Test The Top of The Structure
The Russell 2000 is approaching the top of its structural zone near 2276. The bullish sentiment is driving indices to all-time highs and it could also propel the Russell 2000 higher.
On the daily chart, the price is nearing the 2276 level again. On lower time frames, a new bullish pattern is forming, indicating a potential continuation of the upward movement.
If the price surpasses the 2240 target, the likelihood of further gains increases, as shown on the chart. A move above this zone should push the Russell 2000 higher.
You may find more details in the chart!
Thank you and Good Luck!
❤️PS: Please support with a like or comment if you find this analysis useful for your trading day❤️

US2000 H4 | Heading into multi-swing-high resistanceUS2000 is rising towards a multi-swing-high resistance and could potentially reverse off this level to drop lower.
Sell entry is at 2,278.81 which is a multi-swing-high resistance.
Stop loss is at 2,328.00 which is a level that sits above the 127.2% Fibonacci extension level and the all-time high.
Take profit is at 2,218.24 which is an overlap support.
High Risk Investment Warning
Trading Forex/CFDs on margin carries a high level of risk and may not be suitable for all investors. Leverage can work against you.
Stratos Markets Limited (www.fxcm.com):
CFDs are complex instruments and come with a high risk of losing money rapidly due to leverage. 62% of retail investor accounts lose money when trading CFDs with this provider. You should consider whether you understand how CFDs work and whether you can afford to take the high risk of losing your money.
Stratos Europe Ltd (www.fxcm.com):
CFDs are complex instruments and come with a high risk of losing money rapidly due to leverage. 59% of retail investor accounts lose money when trading CFDs with this provider. You should consider whether you understand how CFDs work and whether you can afford to take the high risk of losing your money.
Stratos Trading Pty. Limited (www.fxcm.com):
Trading FX/CFDs carries significant risks. FXCM AU (AFSL 309763), please read the Financial Services Guide, Product Disclosure Statement, Target Market Determination and Terms of Business at www.fxcm.com
Stratos Global LLC (www.fxcm.com):
Losses can exceed deposits.
Please be advised that the information presented on TradingView is provided to FXCM (‘Company’, ‘we’) by a third-party provider (‘TFA Global Pte Ltd’). Please be reminded that you are solely responsible for the trading decisions on your account. There is a very high degree of risk involved in trading. Any information and/or content is intended entirely for research, educational and informational purposes only and does not constitute investment or consultation advice or investment strategy. The information is not tailored to the investment needs of any specific person and therefore does not involve a consideration of any of the investment objectives, financial situation or needs of any viewer that may receive it. Kindly also note that past performance is not a reliable indicator of future results. Actual results may differ materially from those anticipated in forward-looking or past performance statements. We assume no liability as to the accuracy or completeness of any of the information and/or content provided herein and the Company cannot be held responsible for any omission, mistake nor for any loss or damage including without limitation to any loss of profit which may arise from reliance on any information supplied by TFA Global Pte Ltd.
The speaker(s) is neither an employee, agent nor representative of FXCM and is therefore acting independently. The opinions given are their own, constitute general market commentary, and do not constitute the opinion or advice of FXCM or any form of personal or investment advice. FXCM neither endorses nor guarantees offerings of third-party speakers, nor is FXCM responsible for the content, veracity or opinions of third-party speakers, presenters or participants.

Russel heading into resistance?Hi Guys
The Russell 2000 is currently heading towards an area where we may find sellers stepping in and offering some strong resistance.
The pink zone on the chart is that area and it contains an unmitigated daily order block. The big players will surely have orders to fill there and have been waiting a while for
the opportunity to do so.
Also the zone is between the 78.6 and 88.6 fib levels measuring from hi to low thus making it a premium sell zone. Looking left on the chart we can see that this area had some strong reactions when price was there before the bear market.
The Russell is getting strong support at the 200 ma (purple line) and both the AVWAPS from high and low of the chart so if we get astrong pullback soon look for the 200 ma and the AVWAPS for support and possible buy setups.
There is also a butterfly harmonic pattern developing with nice structure and can finish at either the 1.27 or 1.618 extension of the D point. Both those points look good for sell opportunities.
Safe trading all

RUT2K Short-Term Selloff Likely After Fed Rate Cut DecisionIf you haven’t seen my RUT 2000 prediction for 2024:
Now you need to know that as the Federal Reserve’s rate cut decision looms, speculation is rising that we may see a larger-than-expected 50 basis point cut instead of the anticipated 25. While rate cuts are typically a positive for equities, this aggressive move could lead to a short-term selloff, particularly in smaller-cap stocks, represented by the RUT Russell 2000.
The reasoning is tied to the market's well-known "buy the rumor, sell the news" behavior. With expectations already priced in for a 25 bps cut, a surprise 50 bps cut could trigger concerns over economic health, prompting investors to de-risk. This would likely lead to a temporary selloff in riskier, smaller-cap stocks, with RUT2K potentially taking a hit in the near term.
Given this outlook, I’m considering the $204 strike price puts expiring on October 18, 2024. These options could provide a solid hedge or a potential profit opportunity if the market reacts negatively to the Fed’s decision in the short term, as I expect smaller-cap stocks to feel the pressure more acutely than large-cap counterparts.
Despite this expected volatility, the broader market should recover before the end of the month, once investors fully digest the news. By November 5th, on U.S. election day, we could even see new all-time highs in major indices like the S&P 500 (SPX) and Nasdaq 100 (NDX). Small caps, however, may take longer to rebound, adding further value to a short-term put position in IWM.
Fed Chair Jerome Powell appears motivated to support a strong market ahead of the elections, which could benefit Democrats. Former President Donald Trump has indicated he would not reappoint Powell if he returns to office, potentially giving Powell incentive to maintain market stability leading up to November.
In summary, while a larger-than-expected rate cut could cause IWM ( Russell 2000 ETF ) to face short-term turbulence, the market will likely stabilize by the end of September. The $204 strike price puts expiring on October 18, 2024, offer a timely opportunity for traders seeking to capitalize on this brief volatility.

RUSSELL 2000 Strong buy on the 1st 1W Golden Cross in 3.5 years!The Russell 2000 (RUT) index gave us an excellent buy signal on June 19 (see chart below), hit our 2293 Target and immediately pulled-back to the 1W MA200 (orange trend-line):
The established pattern on the long-term is a Channel Up that first drove the price to Resistance 1 (and our Target) and now guiding it to Resistance 2. The 1W MA50 (blue trend-line) is providing the Higher Low support needed to sustain the Channel Up trend.
The key development this week is the formation of the first 1W Golden Cross since January 2021. We expect that to be enough to resume the Bullish Leg and post at least another +27% rise (as in October - December 2023). As a result our Target is 2400.
-------------------------------------------------------------------------------
** Please LIKE 👍, FOLLOW ✅, SHARE 🙌 and COMMENT ✍ if you enjoy this idea! Also share your ideas and charts in the comments section below! This is best way to keep it relevant, support us, keep the content here free and allow the idea to reach as many people as possible. **
-------------------------------------------------------------------------------
💸💸💸💸💸💸
👇 👇 👇 👇 👇 👇

small cap is about to get hitPeople is about to get out of posisions i think this is the next bearmarket Going deeper then 2023

US2000 Selloff | Small Caps Looking FrailLot's going on in this picture, my apologies for all the noise.
Consistent with the overall market and recently published indexes, I am looking for more downside in US Domestic small-cap stocks.
If you thought or if you were influenced that this inflation bubble economy would persist forever, I advise you consider a different source of information. "Do your own research" does NOT mean, go find something that agrees with your preferences.
Rather, #DYOR as the kids say, is an opportunity for individuals and teams alike to look deep within themselves and ask if they have what it takes to achieve: honesty, humility, and truth.

RUT vs SPXSmall cap vs SP500 is in an interesting spot.
This can be seen as a back test of the breakout. I am expecting more chops going forward for a period of time, similar to 2nd half of 2020.

The RUT Classic Bull TrapOver the last years RUT has formed a textbook version of the "Return to normal" bull trap.
Recently it spiked in a W pattern into the resistance level that stopped the 2021 rally.
Suddenly, people who've never mentioned RUT before are explaining how this is a critical bullish breakout.
What could possibly go wrong?

Russell priced in GoldEmbryonic Capital Rotation Event Observations
Clues to #gold, #silver and #Miners moving up +100% are seen in this chart for #Russell versus #Gold.
Later, when the big boys #Spx and #Nasdaq falter, we get a full fledged precious metals complex bull era on our hands.

US2000 / RUSSELL 2000 Money Heist Plan on Bullish SideMy Dear Robbers / Money Makers,
This is our master plan to Heist US2000 / RUSSELL 2000 Market based on Thief Trading style Technical Analysis.. kindly please follow the plan I have mentioned in the chart focus on Long entry. Our target is Red Zone that is High risk Dangerous level, market is overbought / Consolidation / Trend Reversal at the level Bearish Robbers / Traders gain the strength. Be safe and be careful and Be rich.
Note: If you've got a lot of money you can get out right away otherwise you can join with a swing trade robbers and continue the heist plan, Use Trailing SL to protect our money.
Entry : Can be taken Anywhere, What I suggest you to Place Buy Limit Orders in 15mins Timeframe Recent / Nearest Swing Low
Stop Loss : Recent Swing Low using 2h timeframe
Warning : Fundamental Analysis comes against our robbery plan. our plan will be ruined smash the Stop Loss. Don't Enter the market at the news update.
Loot and escape on the target 🎯 Swing Traders Plz Book the partial sum of money and wait for next breakout of dynamic level / Order block, Once it is cleared we can continue our heist plan to next new target.
Support our Robbery plan we can easily make money & take money 💰💵 Follow, Like & Share with your friends and Lovers. Make our Robbery Team Very Strong Join Ur hands with US. Loot Everything in this market everyday make money easily with Thief Trading Style.

US2000: Long Limit Order with 1:2 RRI'm setting a long limit order on US2000 with a 1:2 risk-to-reward ratio. This trade is based on my personal strategy, aiming to capitalize on a specific price level. Remember to manage your risk, as this is not financial advice.

US Russel 2000 | Chart & Forecast SummaryKey Indicators on Trade Set Up in General
1. Push Set Up
2. Range Set up
3. Break & Retest Set Up
Active Sessions on Relevant Range & Elemented Probabilities;
* Asian(Ranging) - London(Upwards) - NYC(Downwards)
* Weekend Crypto Session
Trend | Time Frame Conductive | Daily Time Frame
- General Trend
- Measurement on Session
* Support & Resistance
* Trade Area | Focus & Motion Ahead
# Position & Risk Reward | 1 Hour Time Frame
- Measurement on Session
* Retracement | 0.5 & 0.618
* Extension | 0.88 & 1
Conclusion | Trade Plan Execution & Risk Management on Demand;
Overall Consensus | Buy

$RUT <> $BTCDespite popular belief that Bitcoin operates independently, it closely mirrors the Russell 2000 index during risk-on market periods. Both assets show strong correlation, attracting investors seeking higher returns in optimistic economic conditions. This parallel movement reveals Bitcoin's growing alignment with broader market risk sentiment, though it typically exhibits more extreme volatility.
September News:
-Fri, Sep 6th Unemployment Rate & Labor Force Data
-Wed, Sep 11th Consumer Price Index (CPI)
-Wed, Sep 18th FOMC Meeting (Rate Cuts)

NASDAQ Time to move more aggressively to the tech sector!Nasdaq (NDX) may be underperforming on its August recovery relative to the other indices (S&P500 and Russell 2000) but as the monthly candle closes today, there is a very encouraging signal coming from an index ratio that shows that this may be the time to get heavier on tech.
We will use the Russell 2000 index (RUT) as it represents a wider array of companies and place it against Nasdaq on the RUT/NDX ratio. Naturally over the years (this 1M chart shows data since 2006), the ratio declines within a Channel Down as historically the riskier tech sector attracts more capital and grows more.
However there are instances where Russell gains more against Nasdaq. We are currently though at a time where this isn't the case as the ratio seems to be under a consolidation that on previous fractals (March 2015, September 2008) led to more decline, thus gains for Nasdaq.
As you can see, this movements can be grasped by the Sine Waves, though not perfectly, but still goo enough to understand the cyclical pattern we're in, also with the help of the 1M RSI Triangles.
Nasdaq (which is represented by the blue trend-line) has started massive expansion Channel Up patterns following this unique signal given by the RUT/NDX ratio. The first was right after the 2009 Housing Crisis bottom and the second during the 2015/ 2016 E.U., VW and Oil crisis.
As a result, this could be an indication that even though the last crisis we had was 2022 Inflation Correction, Nasdaq may be starting a new bullish wave of massive gains against the rest of stock indices.
-------------------------------------------------------------------------------
** Please LIKE 👍, FOLLOW ✅, SHARE 🙌 and COMMENT ✍ if you enjoy this idea! Also share your ideas and charts in the comments section below! This is best way to keep it relevant, support us, keep the content here free and allow the idea to reach as many people as possible. **
-------------------------------------------------------------------------------
💸💸💸💸💸💸
👇 👇 👇 👇 👇 👇
