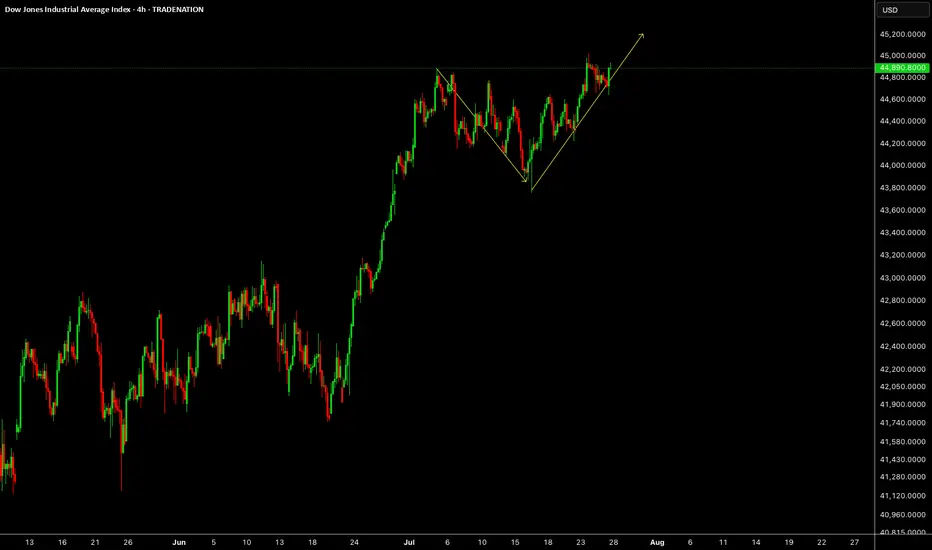
US30US30 needs some more upside short term towards 45.2K level.
Disclosure: We are part of Trade Nation's Influencer program and receive a monthly fee for using their TradingView charts in our analysis.
US30 trade ideas
US30 H4 IdeaThe Federal Reserve meets next week and is widely expected to leave rates unchanged at 4.25%–4.50%. Still, market participants will watch for commentary on inflation and rate-cut prospects, especially after recent criticism of Fed Chair Powell by President Trump.
What Should Traders Watch?
With the major indexes on track for weekly gains, next week’s developments could test the market’s resilience.

US30 Correction with in a Downtrend ChannelUS30 is currently in a consolidation phase within a broader bullish trend. From our previous analysis, the index has shown strong upward momentum. However, to confirm a potential bearish shift, the price would need to break back below key support levels, potentially leading to a deeper correction.
If the price stabilizes above 44,000 on the 4H timeframe, this would strengthen the bullish momentum. A sustained move above this level could open the path towards the next targets at 45,200 and 45,400.
You May find more details in the chart.
Ps: Support with like and comments for better analysis
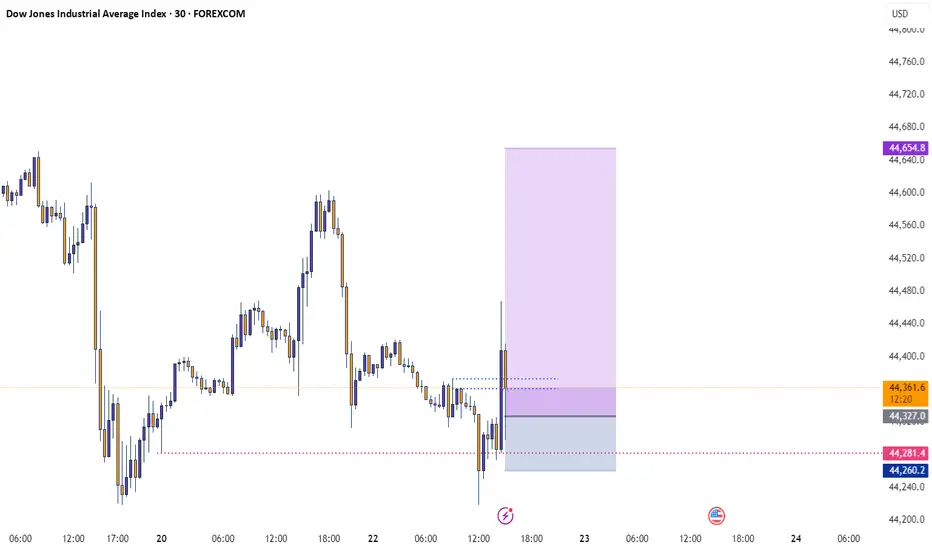
Long Position on Dow Jones Industrial Average
Initiating a long position at 44,456, supported by robust economic data and stronger-than-expected corporate earnings. These indicators point to continued resilience in the U.S. economy, potentially allowing the Federal Reserve to consider rate cuts sooner than previously anticipated — a positive catalyst for equities.
📌 Entry: 44,456
🛑 Stop Loss: 44,207
🎯 Take Profit: 44,900
Monitoring price action closely as market sentiment continues to shift in response to macroeconomic developments.

US30: The Market Is Looking Down! Short!
My dear friends,
Today we will analyse US30 together☺️
The recent price action suggests a shift in mid-term momentum. A break below the current local range around 44,306.1 will confirm the new direction downwards with the target being the next key level of 44,263.8..and a reconvened placement of a stop-loss beyond the range.
❤️Sending you lots of Love and Hugs❤️

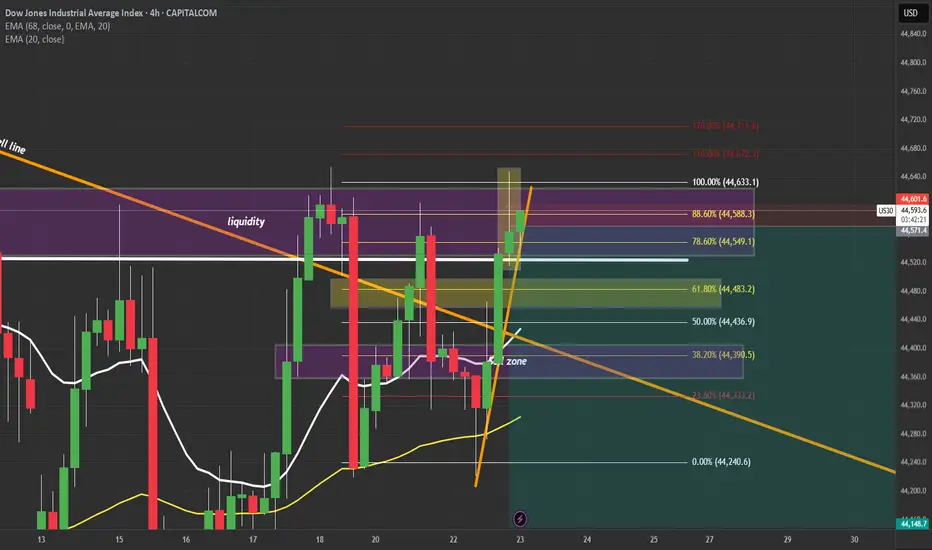
US30 Update – 07/22/2025📍 US30 Update – 07/22/2025
Still trapped in the range chop ⚠️
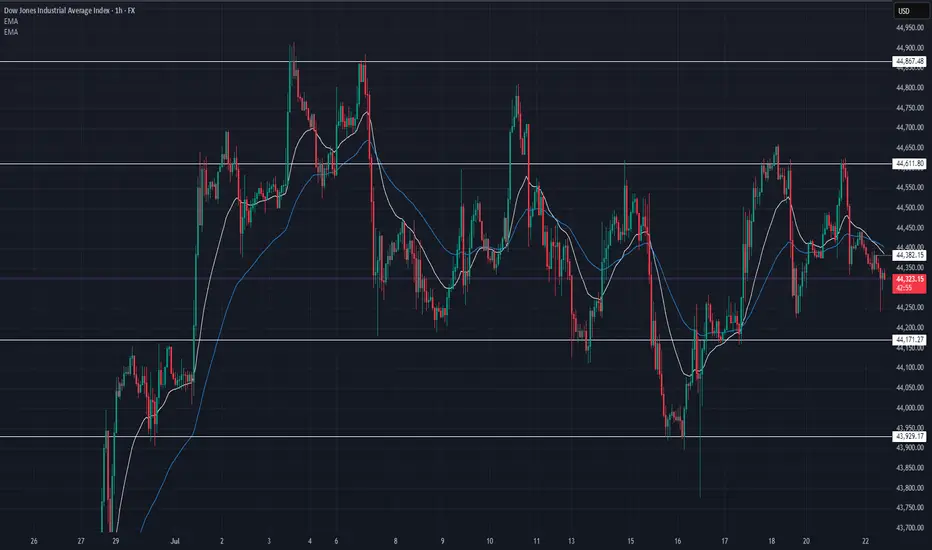
Price rejected off 44,611 again and is now pulling back toward mid-range. Structure continues to respect key zones, and we now see lower highs forming — early signs of bearish pressure building 🐻
EMA crossover is flipping bearish on the 1H — sellers gaining control short term.
📊 Market Structure:
📉 Lower highs forming below 44,611
📈 Still above demand at 44,171
📉 EMA 9/21 crossover down — bearish tilt
📉 Momentum weak under 44,385
🔑 Key Levels:
🔼 Resistance: 44,611 → 44,867
🔽 Support: 44,171 → 43,929
🧠 Market Bias:
Short-term bearish 🧨
➡️ Clean breakdown of 44,171 = bearish momentum
➡️ Buyers must reclaim 44,385 to shift bias
💡 Trade Scenarios:
📉 Bearish Rejection Play:
Entry: 44,380–44,400
TP1: 44,200
TP2: 44,000
SL: Above 44,430
📈 Demand Bounce (Low-Risk Buy):
Entry: 44,180–44,150
TP1: 44,385
TP2: 44,600
SL: Below 44,100
Dow Jones is Nearing an Important Support!!Hey Traders, in today's trading session we are monitoring US30 for a buying opportunity around 43,950 zone, Dow Jones is trading in an uptrend and currently is in a correction phase in which it is approaching the trend at 43,950 support and resistance area.
Trade safe, Joe.

US30US30 needs some more correction, this week will be up and down both moves.
Disclosure: We are part of Trade Nation's Influencer program and receive a monthly fee for using their TradingView charts in our analysis.
US30 ATH coming?Update to my last port wondering if I should add, what would you do in this situation?
Dow Jones move upThe Dow Jones is resuming its rally toward 45,082 from the price zones of 44,154.97 and 44,000.
CMCMARKETS:US30
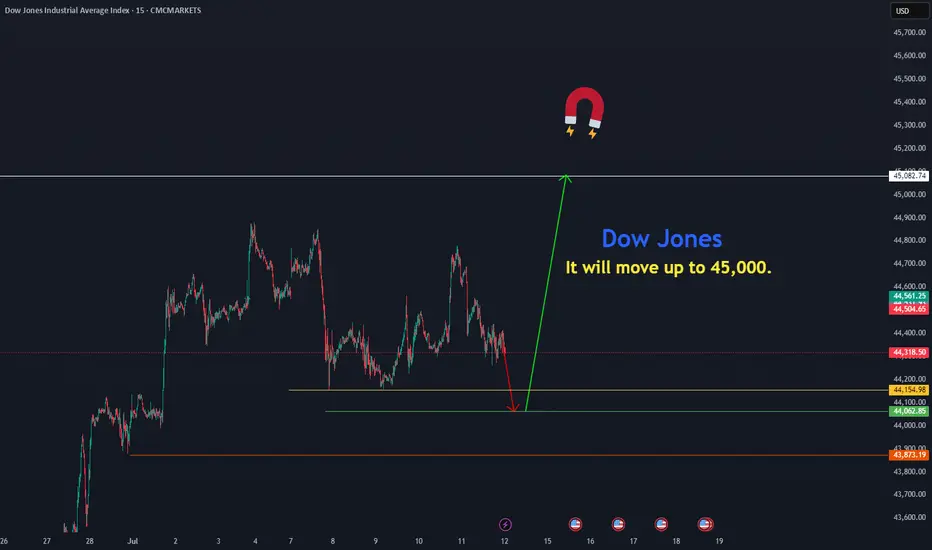
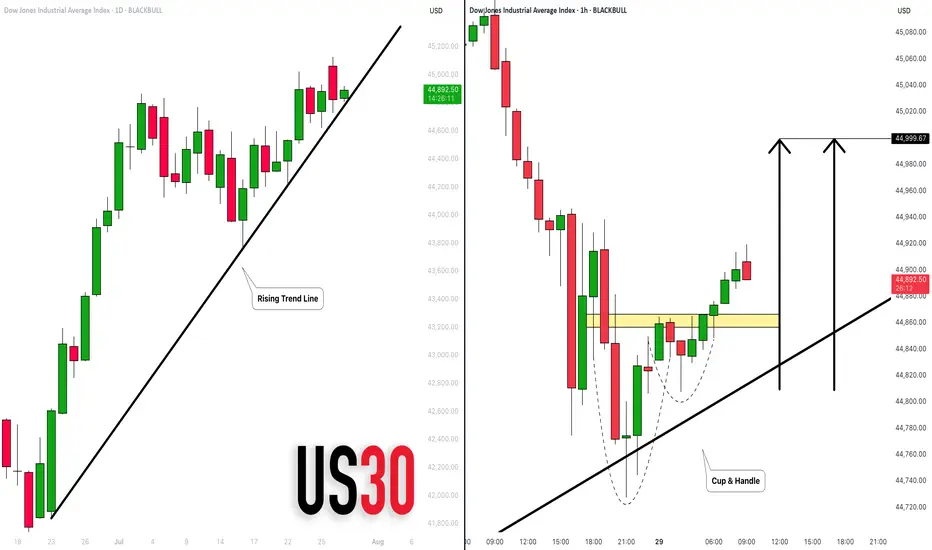
DOW JONES INDEX (US30): Bullish Move From Trend Line
There is a high probability that US30 will continue rising today,
following a test of a solid rising trend line on a daily.
As a confirmation, I see a cup & handle on that after its test
on an hourly time frame.
Goal - 45000
❤️Please, support my work with like, thank you!❤️
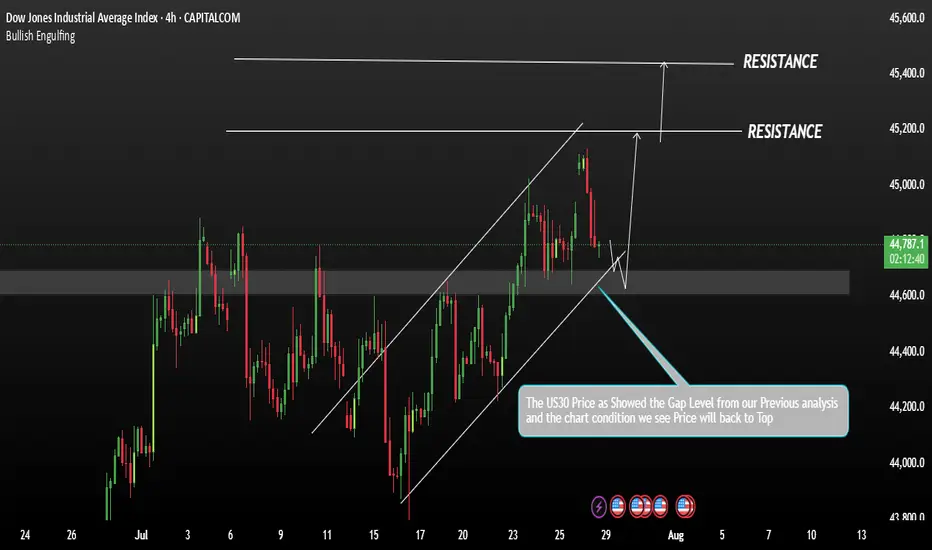
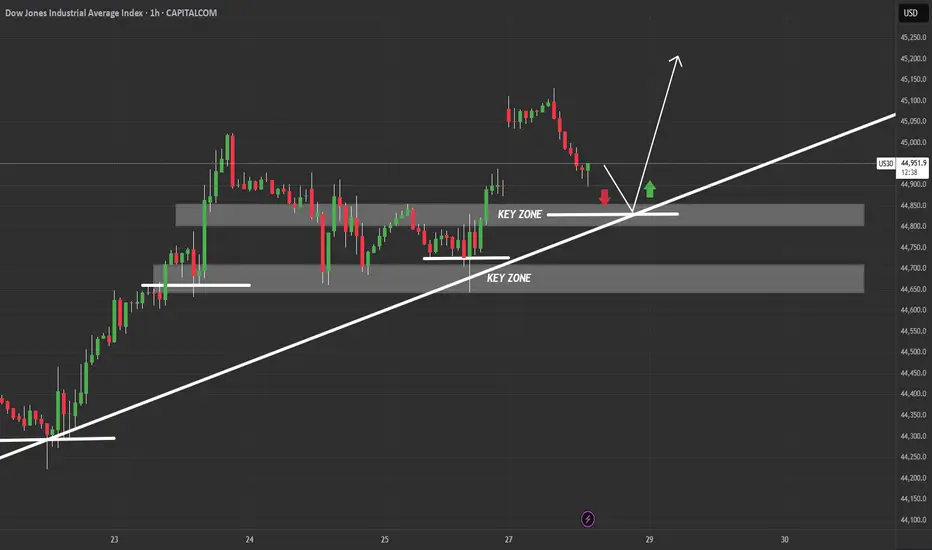
Getting ready for new highs Price tested the 45000 resistance which is the final resistance before new highs, it is now going down to test the trend line support of the uptrend channel
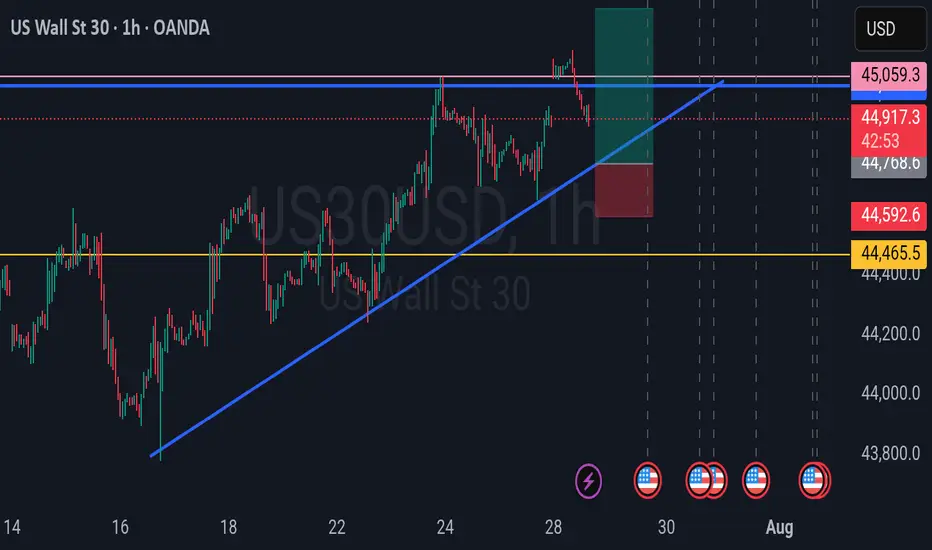
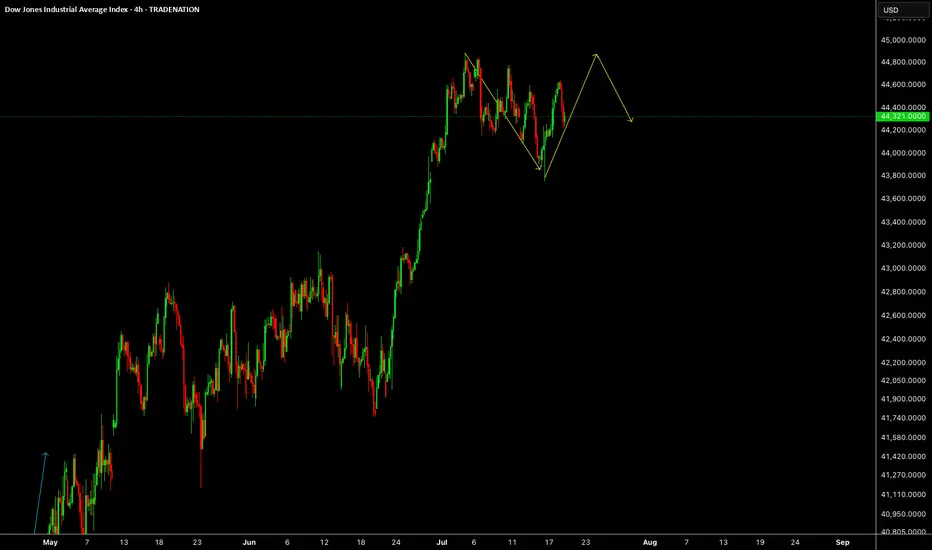
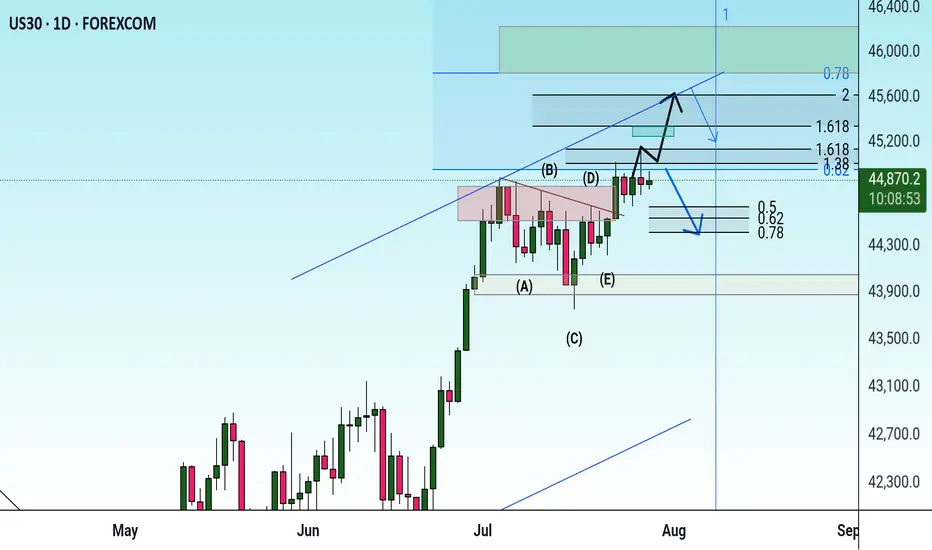
US30 Weekly Forecast – Bullish Bounce or Breakdown?Hope everyone had a great weekend!
This chart outlines a critical US30 intraday structure with price currently pulling back into a key confluence zone composed of:
A rising trendline from July 23rd
Two stacked demand zones, the upper around 44,850 and lower near 44,700
Bullish Scenario (Preferred Bias):
If price respects the trendline and upper key zone, we may see a bullish continuation targeting the 45,150–45,250 range.
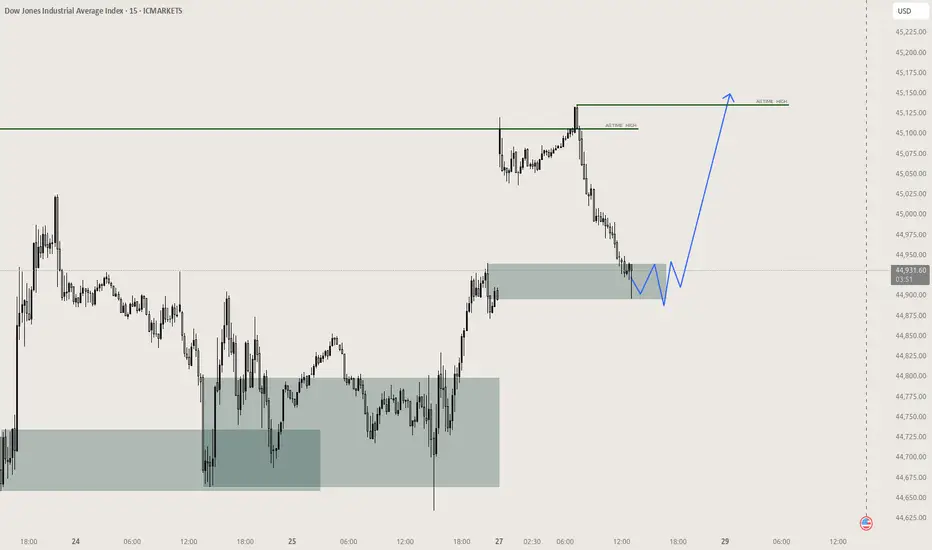
The clean bounce zone, marked by the green arrow, suggests smart money might defend this level.
Watch for bullish engulfing or low-volume traps near 44,850–44,880 to confirm entry.
Bearish Scenario (Alternate Play):
If price fails to hold the trendline, and breaks below the 44,850 key zone with momentum, expect a drop into the lower zone (44,650–44,700).
A breakdown below this lower demand could shift the bias entirely, opening the door for a deeper correction back into the mid-44,000s.
Weekly Playbook:
Early week: Monitor the reaction at the upper key zone for sniper long opportunities with tight stops.
Mid to late week: If structure fails, flip bias and look for supply rejections on retests for shorts.
Risk: Account for FOMC/major U.S. news events that may introduce volatility traps around these zones.
Verdict: Stay patient. Let price dictate bias at the trendline. If it holds, this could be a textbook bounce continuation setup.

Buy
Rejection Level
Daily Volume
Market Structure Shift
London Session
Trend Line Break
Untapped Order Point
US30: MEXT MOVE!!Longs on US30!! I see price heading towards the EH on the !W chart because above it rests a pool of liquidity. Entry on 1hr missed entry on 15min.

US30 | Inverted Hammer at Key Supply Zone – Reversal or BreakoutUS30 just printed an inverted hammer on the 4H at a major supply zone (44,550–44,600). This is a critical decision point:
✅ Bearish Case:
If price rejects and closes back below 44,530, sellers could take control with targets at 44,380 → 44,180 → 44,020.
✅ Bullish Fakeout:
If price breaks and holds above 44,620, expect a push toward 44,700 and 44,900.
📌 What I’m Watching:
Rejection candle + bearish close → short entries.
Strong breakout candle with retest → long continuation.
Key Levels:
🔴 Resistance: 44,550–44,600
🟢 Support: 44,380 → 44,020
⚠️ Manage risk carefully. Volatility is high and liquidity hunts are common in this zone.
💬 Do you think we reject here or break out higher? Drop your thoughts below!
#US30 #DowJones #PriceAction #SmartMoney #TradingView #TechnicalAnalysis #IndicesTrading
Possibility of uptrend The uptrend is expected to move in the specified direction and advance to the specified targets. If the indicator does not consolidate above the current resistance level, there is a possibility of a double-digit combination pattern. Then a correction is likely.
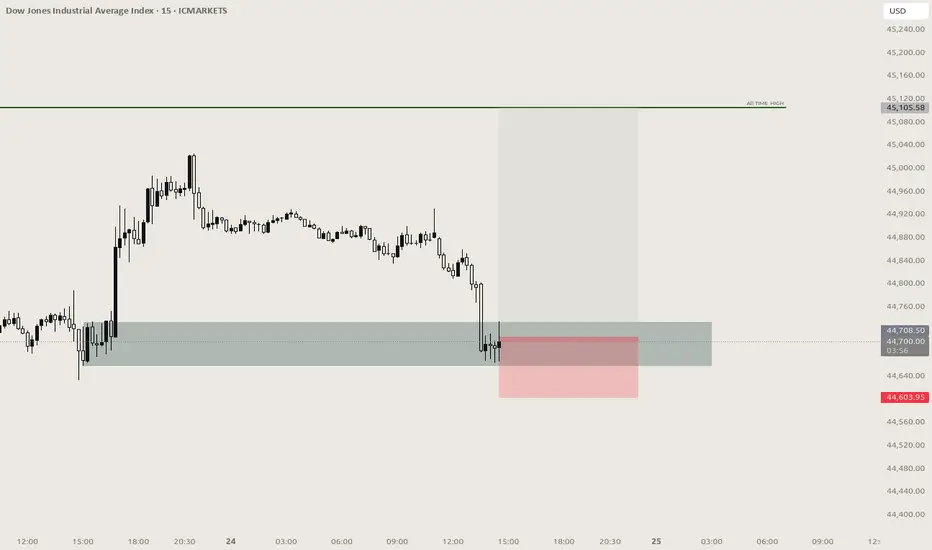
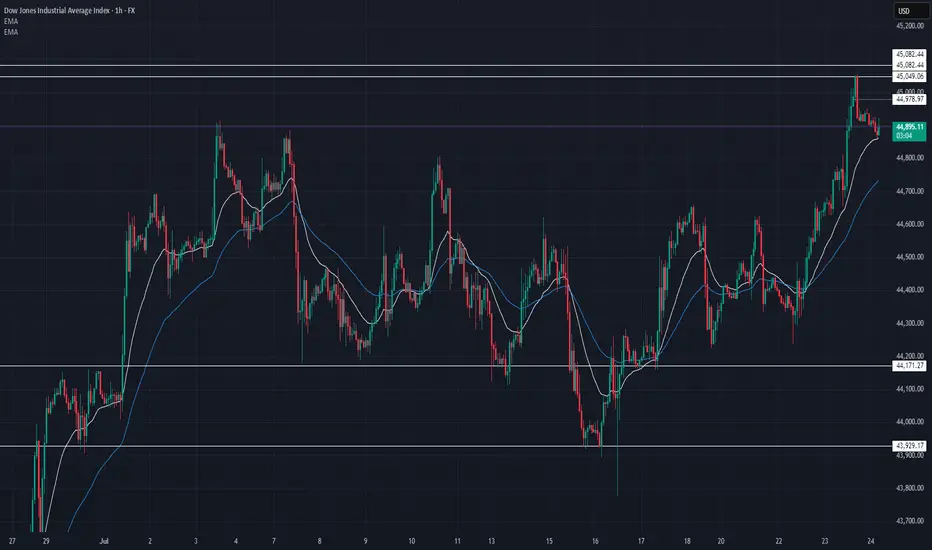
US30 Technical Breakdown – 07/24/2025📍 US30 Technical Breakdown – 07/24/2025
🔥 New highs achieved — bulls pushed straight through the 44,867 ceiling and tagged 45,082 before pulling back slightly. This is a key psychological level, and price is now consolidating just below.
We’ve officially shifted into breakout territory. Momentum is strong, and EMAs are fully bullish. But after such a run, we may be due for a retest or short-term correction. Let’s break it down 👇
📊 Current Market Structure:
✅ Series of higher highs & higher lows
✅ EMA 9 > EMA 21 > Price (bullish structure)
✅ Breakout from range: 44,867 → 45,082
🧱 Minor resistance at 45,050–45,082
⚠️ Watch for pullback to 44,750–44,800 zone
🔑 Key Levels:
🔼 Resistance:
45,050 → 45,082 (fresh supply zone)
45,200+ (blue sky if broken)
🔽 Support:
44,867 (former resistance turned support)
44,734 (EMA confluence)
44,450–44,600 (demand zone)
🧠 Market Bias:
📈 Still bullish, but extended.
Above 44,867 = continuation zone
Below 44,734 = momentum shift likely
Rejection at 45,082 could give scalpers a play short 🔄
💡 Potential Trade Setups:
📈 Breakout Buy (Momentum Entry):
Entry: Above 45,100
TP1: 45,200
TP2: 45,300
SL: Below 45,040
EURUSD & US30 Trade Recaps 18.07.25A long position taken on FX:EURUSD for a breakeven, slightly higher in risk due to the reasons explained in the breakdown. Followed by a long on OANDA:US30USD that resulted in a loss due to the volatility spike that came in from Trump.
Full explanation as to why I executed on these positions and the management plan with both.
Any questions you have just drop them below 👇

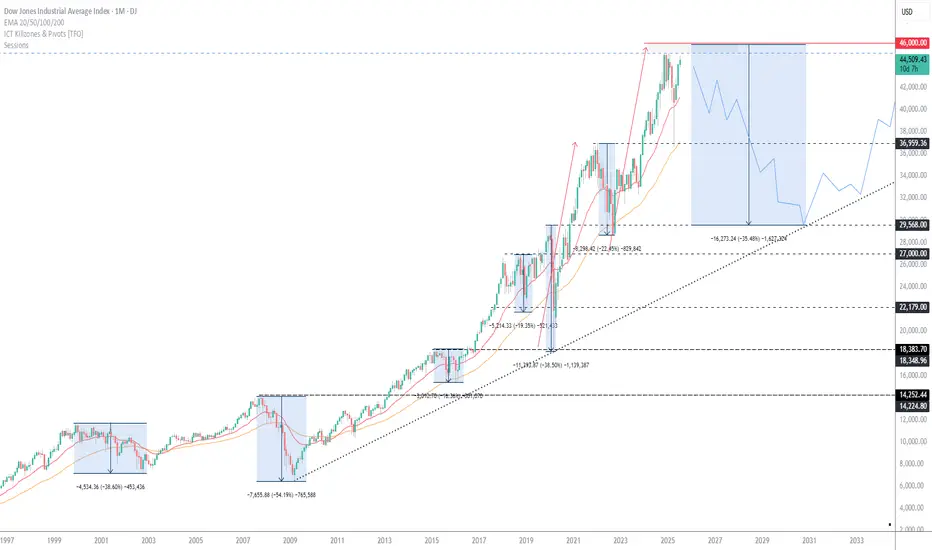
Dow Jones -> A breakout rally of +40%!🐂Dow Jones ( TVC:DJI ) will create new highs:
🔎Analysis summary:
Since the April lows, the Dow Jones already rallied about +25%. This was simply the expected rejection away from a strong confluence of support. Now, the Dow Jones is sitting at the previous all time highs and about to break out, leading to a massive rally.
📝Levels to watch:
$45.000, $60.000
🙏🏻#LONGTERMVISION
Philip - Swing Trader
