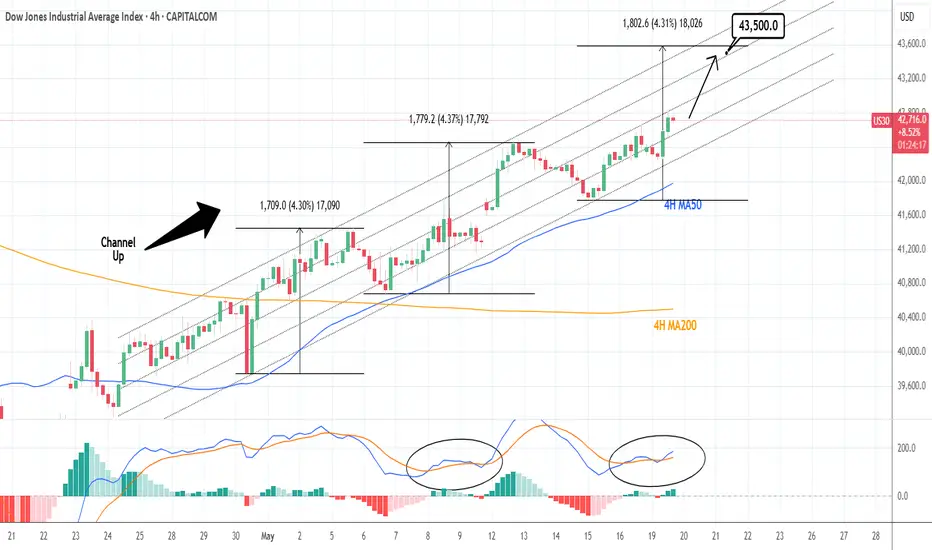
DOW JONES: Looks to extend gains to 43,500Dow Jone remains bullish on its 1D technical outlook (RSI = 62.492, MACD = 410.840, ADX = 32.007) as it maintains the medium term bullish trend inside its 1 month Channel Up. Since the index kept the 4H MA50 intact, it established it as its Support and is now halfway on the new bullish wave. The 2 prior rose by +4.30%, which gives a clear technical target (TP = 43,500)for the next HH.
## If you like our free content follow our profile to get more daily ideas. ##
## Comments and likes are greatly appreciated. ##
US30 trade ideas
US30 – Supply Zone Hit & Rejection | Is the Rally Over?US30 has just tapped a strong supply zone around 42,752, followed by immediate rejection. With price sitting at a critical turning point, here’s how I’m preparing to trade the Dow this week.
---
Chart Breakdown:
1. Supply Zone (42,600 - 42,800):
Price aggressively entered this area and got rejected fast. Historically, this zone has caused sharp moves down, and the reaction today aligns with that pattern.
2. Key Support (42,288.87):
Watch this level closely. A clean break and retest below here would confirm bearish momentum, potentially triggering a selloff.
3. Demand Zone (41,767 - 41,900):
This orange zone has previously fueled strong bullish rallies. If price dips back here, look for a bounce or bullish confirmation setup.
---
Bearish Plan (Short Bias):
Entry: Break + retest of 42,288
TP1: 42,012
TP2: 41,767
SL: Above 42,800 (supply high)
Bullish Alternative:
If price holds above 42,288 and forms a higher low, a retest of the 42,750s could be in play. But for now, the supply reaction suggests caution.
---
What to Watch:
US economic data (jobless claims, inflation)
FOMC or Fed speakers
Risk sentiment shifts (S&P/Nasdaq correlation)
---
Your Take?
Do you think this was a false breakout or the start of a deeper pullback? Comment your setup or target below!
---
#US30 #DowJones #SupplyAndDemand #PriceAction #SmartMoneyConcepts #IndicesTrading #TradingView #US30Forecast

US 30 Long - 43057The Index is long and expected to hit the levels of 43057.
The index can retrace to the levels of 42680 or even 42565 before going long.
There is a high chance the retrace never happen.

US30 - Key Breakout Scenario📊 US30 - Key Breakout Scenario
If the price successfully breaks and holds above the 42,656 level, we could consider opening a relatively risky long position. This level has previously acted as a resistance, and a confirmed breakout may indicate bullish continuation.
However, due to recent price volatility and lack of strong impulsive momentum, the entry would be classified as aggressive unless further confirmation is received.
🧠 Strategy:
Aggressive Entry: On a confirmed breakout and 15m or 1H candle close above 42,656 with volume support.
Safer Entry: Wait for a pullback to 42,656 and a bullish reaction (support confirmation) before entering long.
Target: Potential move toward the next resistance zone around 43,302.
Stop-loss: Below 42,500, where recent support structure lies.
⚠️ Caution: This setup becomes much stronger if today's FOMC sentiment aligns with the overall market bullish trend.

Correction and a push up US30 has been gradually climbing but this growth may have to correct a bit before continuing up. After reaching the 41,800 gap, the indice rose a bit, but may have ran out of steam to further go up. The nearest support will be the likely area where the indice may find buying pressure, if price action remains above the support barriers.

US30 (Dow Jones) – 19 May 2025 Breakdown📉 US30 (Dow Jones) – 19 May 2025 Breakdown ⚠️
The Dow just lost the key 42,300 level after struggling to hold above it, signaling momentum shift in the short term 🧯
🔍 Technical Breakdown:
📍 Current Price: 42,263
🔻 Support lost: 42,300
❌ Lower high formed under 42,700
📉 EMAs starting to cross downward – early signs of a short-term trend shift
After failing to hold above 42,700, price dropped aggressively and is now sitting right under previous structure support turned resistance.
🔥 Key Scenarios:
Bearish case 🔴:
Rejection at 42,300–42,350 = likely continuation toward 42,100 and 41,900
Clean break of 42,100 could open up a move to 41,600 zone
Bullish recovery 🟢:
Reclaim 42,300 + strong close = chance to revisit 42,500–42,700
Watch for a fakeout and EMA compression reset
🧠 Pro Tip:
⚠️ Breakdowns below structure with confluence (e.g., EMA crossover + volume spike) often lead to momentum flushes
➡️ Don’t fight the shift — adapt fast
➡️ Lower highs = sellers taking control

Bullish momentum ahead?Direction: LONG
Targets:
- T1 = $43500
- T2 = $44200
Stop Levels:
- S1 = $42000
- S2 = $41500
**Wisdom of Professional Traders:**
This analysis synthesizes insights from thousands of professional traders and market experts, leveraging collective intelligence to identify high-probability trade setups. The wisdom of crowds principle suggests that aggregated market perspectives from experienced professionals often outperform individual forecasts, reducing cognitive biases and highlighting consensus opportunities in Dow Jones.
**Key Insights:**
Dow Jones is currently positioned at a crucial technical pivot point, showing strong bullish signals supported by improving macroeconomic conditions. Investor sentiment appears to have turned increasingly optimistic as recent updates on GDP growth exceeded forecasts, and corporate earnings have been beating expectations. The index is trading confidently above its 200-day moving average, showcasing healthy upward momentum.
Market volatility remains subdued, which is historically a prerequisite for steady gains in the Dow Jones. Volume analysis indicates rising accumulation from institutional investors, signaling their confidence in continued upside. With sectors like energy and industrials leading gains, the broader market appears poised for further advances.
**Recent Performance:**
Over the past month, the Dow Jones has climbed nearly 4% from its September lows near the $41000 level. This rally has been sustained by increasing investor risk appetite, particularly following easing concerns over inflation as shown by cooling Consumer Price Index (CPI) data. The index has also outperformed its peers, recording fewer broad-based declines compared to the S&P 500.
**Expert Analysis:**
Technical analysts have highlighted a breakout above the $42500 resistance level, which now acts as strong support. Momentum oscillators such as the RSI (Relative Strength Index) point toward further bullish divergence, suggesting that the upward trend has more room to run. The MACD (Moving Average Convergence Divergence) has crossed into bullish territory, enhancing the case for long positions.
Economists and strategists suggest that fiscal policy stability, combined with a steady labor market, provides a favorable environment for equities. The resilience of key Dow components like Caterpillar and Boeing further underscores the strengthening bullish case.
**News Impact:**
Recent news around potential interest rate pauses by the Federal Reserve has further soothed investor nerves, leading to an influx of capital into blue-chip stocks. Positive economic data from manufacturing and services sectors has also bolstered expectations for a "soft landing" scenario, minimizing recessionary concerns and driving up valuations in core index components.
**Trading Recommendation:**
Given the confluence of technical and fundamental strengths, we recommend a LONG position in the Dow Jones. The entry around the current $42654.74 level provides an attractive risk-to-reward ratio. Targets of $43500 and $44200 correspond to key resistance zones, while stops at $42000 and $41500 provide ample protection against unexpected market reversals. This trade is suitable for medium to long-term horizons, capitalizing on the solid macroeconomic and technical foundation supporting the Dow Jones' upward trajectory.

correctionThe index is expected to fluctuate above the current support level and continue the upward trend after the correction pattern is completed. A break of the support level will cause a continuation of the downward trend.

US30THE US30 could be seeing a mejor upswing ,if only we get little pullback on weekly breakout ,then going long will need final confirmation.

US30 Eyes New Highs – But Pullback Likely FirstThe Dow Jones (US30) remains in a short-term ascending channel, with momentum building toward new highs. However, signs point to a stronger pullback before those upper levels are tested. Watch for the channel base and broader trendline to act as key support before continuation.

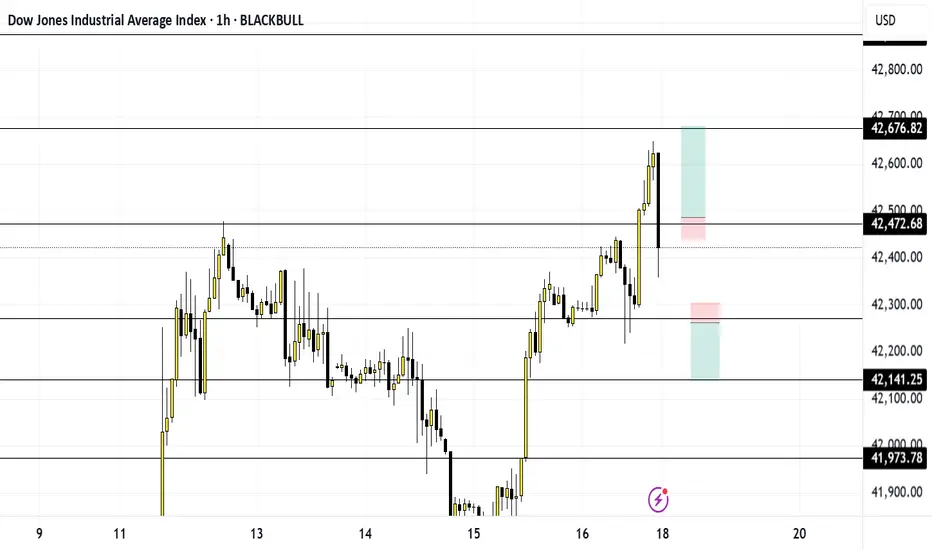
US30 Markup May 18thWhat did the tomato say to the other tomato during a race? Ketchup!! Now lets ketchup on these charts.
Price is in an uptrend and is nearing my key level 42,474. If price breaks and retests that area, then I will get in for the buy and buy up to 42,672 area.
However, like a puppy, price does whatever it wants. So, if price breaks structure around 42,268, I shall wait for price to break and retest that area so I can get in for the sell down to 42,141.
I shall be waiting for the break and retest on the one-minute timeframe for both the buy or sell.
Lastly, enjoy yourself, and be responsible.
Crab vs Order BlocksThe Dow Jones Crab 🦀 finds itself caught in the web of order blocks, navigating a treacherous sea of buyers and sellers.
The golden level of the crab has crept dangerously close to the sellers' order block territory, and all eyes are on the impending tumble.
It seems the crab might just scuttle its way down to the buyers' order block nestled at the very bottom, right by its own clawed feet.
Hold tight, folks—this crustacean's market dance is about to get interesting!

US30 Is Very Bullish! Buy!
Take a look at our analysis for US30.
Time Frame: 1D
Current Trend: Bullish
Sentiment: Oversold (based on 7-period RSI)
Forecast: Bullish
The market is on a crucial zone of demand 42,620.8.
The oversold market condition in a combination with key structure gives us a relatively strong bullish signal with goal 45,530.9 level.
P.S
Overbought describes a period of time where there has been a significant and consistent upward move in price over a period of time without much pullback.
Disclosure: I am part of Trade Nation's Influencer program and receive a monthly fee for using their TradingView charts in my analysis.
Like and subscribe and comment my ideas if you enjoy them!

Bullish continuationwhich is a pullback resistance that lines up with the 161.8% Fibonacci extension.

US30 expectation. 1HMarket supporting strong bullish trend towards destination. Multiple areas of support and a strong trend line from the bottom.

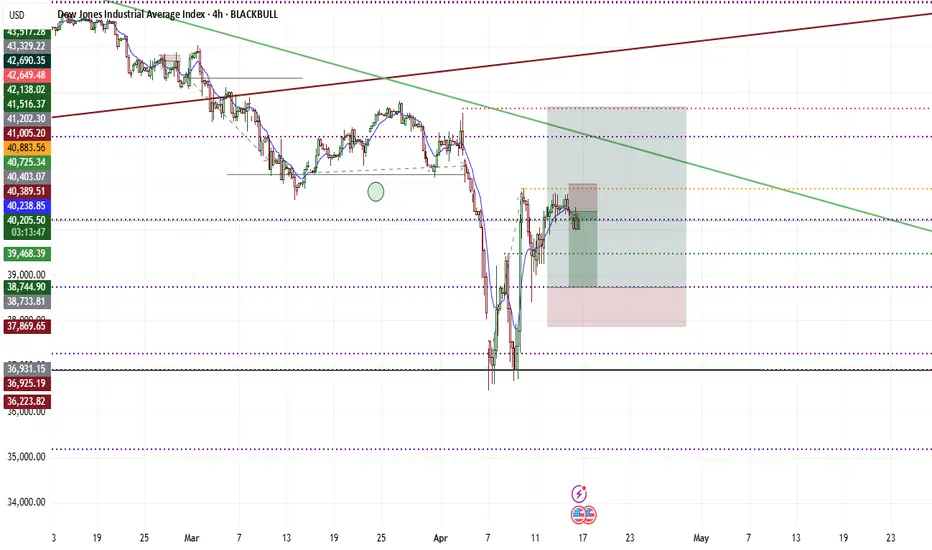
Drop followed followed by long.Dow Jones is currently attempting to continue its bullish resurgence, but has failed to do so by failing to stabilise above 40,883. As long as price action is under the 40k mark, the points may likely retest the previous support barriers, situated between 39,500 and 38,750, as likely bullish catalysts for a long opportunity. However, by failing to go down, breaking, and stabilising above 40,883, the price may continue going up, targeting 42,600 and 42,000.
US TARGETING 40200 THEN WAITING TO BUY Fibonacci retracements are simply tools to spot high‐probability pullback zones. You draw them from swing A→B, watch for price to respect the 38–62% band, then join the trend with stops just beyond the next deeper level. Extensions beyond 100% become logical profit targets.

US30: Next Move Is Up! Long!
My dear friends,
Today we will analyse US30 together☺️
The in-trend continuation seems likely as the current long-term trend appears to be strong, and price is holding above a key level of 42,259.4 So a bullish continuation seems plausible, targeting the next high. We should enter on confirmation, and place a stop-loss beyond the recent swing level.
❤️Sending you lots of Love and Hugs❤️

US30 SHORT1. This is the deciding factor as it is at the high created last week and should have a lot of resistance
2. M15, M30 and H1 are overbought and there is a double top with divergence
3. This is a type 2 pattern on H4 however there is a smaller pattern on M15 below
4. Stop loss of 200 pips

Dow ready to go above 200 MA?The Dow has been coiling for the past few days underneath its 200-day moving average, as it watched the tech-heavy Nasdaq 100 break higher. But yesterday support at 41,780 held and this led to a strong bounce. The resulting price action created a hammer candle on the daily time frame. With this latest bull signal, can the index now break above its 200 MA and move higher? The underlying trend is looking increasingly bullish.
By Fawad Razaqzada, market analyst with FOREX.com

"US30 Heist Alert: Thief Style's Bullish Plan to Steal Profits!"🌟 Salut! Ciao! Hola! Konnichiwa! 🌟
Dear Wealth Raiders & Market Bandits, 🤑💰✈️
Here’s our slick *Thief Trading Style* heist plan for the **US30 / Dow Jones Industrial Average Cash** Index, crafted with sharp technicals and fundamentals. 💥 Stick to the chart’s long entry strategy and aim to slip out near the spicy Yellow ATR Zone—a risky, overbought level where bears and traps lurk. 🏆💸 *Grab profits and treat yourself, you’ve earned it!* 💪🎉
**Entry 📈**: The heist kicks off! Watch for a breakout above the MA line (42600.0) to jump in—bullish riches await! 🤑 Set *buy stop orders* above the MA or *buy limit orders* near the most recent 15/30-min swing low/high for pullback entries. 🚨 Set an *alert* to catch the breakout signal!
**Stop Loss 🛑**: Yo, thieves, listen up! 🗣️ For buy stop orders, hold off on placing that stop loss until the breakout confirms. 🔊 Place it at the 8H recent/swing low (40850.0) for day/swing trades. Adjust SL based on your risk, lot size, and number of orders. Play it smart, or it’s your loot on the line! ⚠️🔥
**Target 🎯**: Aim for 44500.0 or bail before the target hits. 🏴☠️
**Scalpers, eyes here 👀**: Stick to long-side scalps. Big bankrolls can dive in; smaller ones, join the swing trade heist. Use *trailing SL* to lock in your haul. 💰
💸 **US30 Market Heist Outlook**: The index is neutral but leaning bullish, fueled by key drivers. ☝ Check the fundamentals, macroeconomics, COT reports, geopolitics, sentiment, intermarket analysis, and future trend targets for the full score. 🌎🔗
⚠️ **Trading Alert: News & Position Management** 📰🚫
News can shake the market hard. To protect your loot:
- Skip new trades during news releases.
- Use trailing stop-loss orders to secure running profits.
💖 Boost our heist plan! 🚀 Hit that *Boost Button* to power up our robbery squad. With *Thief Trading Style*, we’re snatching profits daily. 🏆🤝 Stay sharp for the next heist plan! 🤑🐱👤🤩
---
### Latest Real-Time Data (UTC+1, May 16, 2025) 📊
*Data sourced from reliable platforms like Financial Juice and official market feeds.*
**Indices** 📈
- US30 (Dow Jones): 42580.0 | +0.18% 😊
- S&P 500: 5720.5 | +0.12% 😄
- NASDAQ 100: 20150.2 | +0.25% 😊
- FTSE 100: 8250.3 | -0.05% 😐
---
### Latest COT Data (Updated Friday, May 9, 2025) 📑
*Commitment of Traders (COT) report for US30/Dow Jones futures, sourced from CFTC.*
- **Non-Commercial (Speculators)**:
- Long: 45,200 contracts | +2,500 😄
- Short: 38,900 contracts | -1,200 😊
- Net Position: +6,300 (Bullish bias) 🟢
- **Commercial (Hedgers)**:
- Long: 82,500 contracts | -1,000 😐
- Short: 90,700 contracts | +800 😐
- Net Position: -8,200 (Bearish hedge) 🔴
- **Open Interest**: 165,400 contracts | +1,200 😊
- **Key Insight**: Speculators are increasing bullish bets, while hedgers lean bearish, signaling potential volatility near resistance levels like the Yellow ATR Zone. ⚠️
---
💥 Join the *Thief Trading* crew, boost the plan, and let’s raid the markets together! 🤑🚀

US30 (Dow Jones) – 16 May 2025 Update📊 US30 (Dow Jones) – 16 May 2025 Update 🚨
Dow Jones just bounced cleanly off the 20 EMA and is now attempting to break through 42,400 resistance 📈
🔎 Technical Breakdown:
📍 Current Price: 42,338
🧭 Key Resistance: 42,400
✅ Strong bounce from 41,800 zone
📊 EMAs sloped up, confirming bullish momentum
This looks like a bullish retest and continuation setup 🔁. Price had a healthy pullback, tapped dynamic support, and now buyers are stepping back in.
🔥 Key Scenarios:
Bullish case 🟢:
Break + close above 42,400 = potential leg up toward 42,600–42,800
EMAs in bullish alignment = trend continuation likely
Bearish case 🔴:
Rejection + close back below 42,200 = retest of 41,800–41,600 support
Would still be a buy-the-dip zone for now
🧠 Pro Tip:
➡️ Don’t short a trending market just because it “looks high”
➡️ Let structure guide you, not emotion
➡️ Tight consolidations near highs = strength 💪

US30 D1 | Bullish Continuation Based on the D1 chart analysis, the price is falling toward our buy entry level at 41,289.74, a pullback support.
Our take profit is set at 43107.01, an overlap resistance.
The stop loss is placed at 40,618.88, a swing low support level.
High Risk Investment Warning
Trading Forex/CFDs on margin carries a high level of risk and may not be suitable for all investors. Leverage can work against you.
Stratos Markets Limited (tradu.com):
CFDs are complex instruments and come with a high risk of losing money rapidly due to leverage. 63% of retail investor accounts lose money when trading CFDs with this provider. You should consider whether you understand how CFDs work and whether you can afford to take the high risk of losing your money.
Stratos Europe Ltd (tradu.com):
CFDs are complex instruments and come with a high risk of losing money rapidly due to leverage. 63% of retail investor accounts lose money when trading CFDs with this provider. You should consider whether you understand how CFDs work and whether you can afford to take the high risk of losing your money.
Stratos Global LLC (tradu.com):
Losses can exceed deposits.
Please be advised that the information presented on TradingView is provided to Tradu (‘Company’, ‘we’) by a third-party provider (‘TFA Global Pte Ltd’). Please be reminded that you are solely responsible for the trading decisions on your account. There is a very high degree of risk involved in trading. Any information and/or content is intended entirely for research, educational and informational purposes only and does not constitute investment or consultation advice or investment strategy. The information is not tailored to the investment needs of any specific person and therefore does not involve a consideration of any of the investment objectives, financial situation or needs of any viewer that may receive it. Kindly also note that past performance is not a reliable indicator of future results. Actual results may differ materially from those anticipated in forward-looking or past performance statements. We assume no liability as to the accuracy or completeness of any of the information and/or content provided herein and the Company cannot be held responsible for any omission, mistake nor for any loss or damage including without limitation to any loss of profit which may arise from reliance on any information supplied by TFA Global Pte Ltd.
The speaker(s) is neither an employee, agent nor representative of Tradu and is therefore acting independently. The opinions given are their own, constitute general market commentary, and do not constitute the opinion or advice of Tradu or any form of personal or investment advice. Tradu neither endorses nor guarantees offerings of third-party speakers, nor is Tradu responsible for the content, veracity or opinions of third-party speakers, presenters or participants.
