US Dollar Index - 4h Chart (CAPITALCOM)4-hour chart of the US Dollar Index (DXY) from CAPITALCOM shows the index's recent price movements. The current value is 96.955, with a slight increase of 0.054 (+0.06%). Key levels include a support at 96.413 and resistance at 97.554. The chart highlights buy signals at 97.012 and sell signals at 96.958 and 96.955, with a notable downward trend breaking below a support zone around 97.150.
USDX trade ideas

dxy buy tradeThe Relative Strength Index (RSI) is showing an upward trend, indicating increasing momentum. Additionally, the Moving Average Convergence Divergence (MACD) is showing a bullish crossover, further supporting the potential for an upward move

DXY – The Trap Is Set. The Drop Is Coming.Wave structure complete.
Retail thinks we’re going up. I know where it’s really going.
This is GreenFire Execution, not prediction.
🧠 Final liquidity hunt possibly toward 98.76 or even 101.40, then lights out.
Targeting the big liquidity pocket at 95.215
That’s where legends buy while the crowd panics.
📐 Elliott Wave | Wedge Mastery | Market Psychology
If you understand this chart — you don’t need signals. You need silence and execution.
#DXYSetup | #Wave5Ready | #SmartMoney | #ForexMillionaire | #TradingViewElite

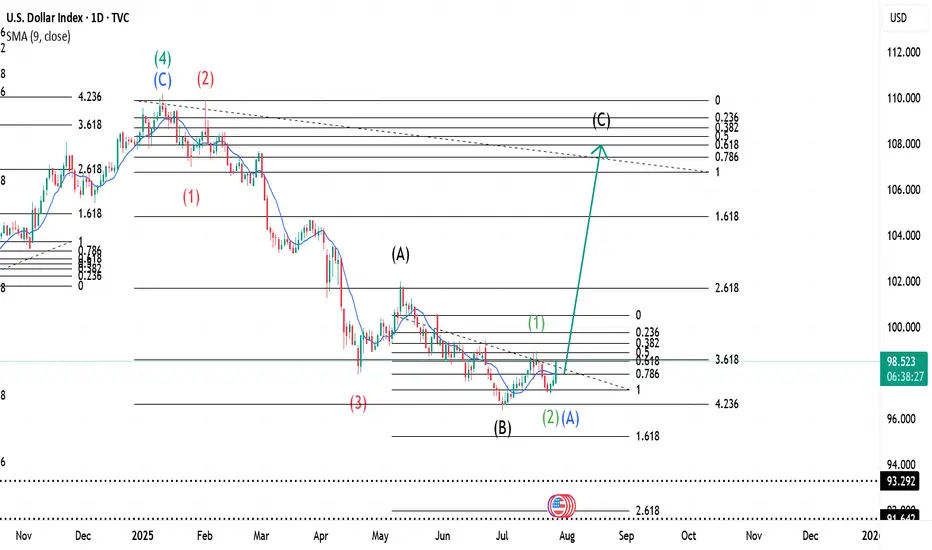
$ INDEX ~ Real Time Elliott Wave UpdatesThis is an update of a $ index chart I had previously posted. We see a Wave 1(Green) completed and a dip occurring. This dip is marked as Wave 2(Green) or Wave A(Blue). It has two readings because it could be a Zigzag, hence 2 or an A of a Flat, hence A. I will offer updates as the wave unfolds. All other analysis remains the same as I had previously posted and can be checked for references. Sentiment still remains buy.
IS A HIGHER LOW SECURED ON THE DXY? LET'S FIND OUTIn this weekend analysis, I am still paying attention to the higher time frame downtrend on the dollar index while acknowledging the higher low support on the daily chart forming an inverse Head and Shoulders pattern. On the 4H and lower timeframes we have a strong ceiling made up of the 200SMA and 50SMA resistance level and need to break through from the 20SMA Line in the sand support. This weeks trade plan and thesis is for price to hold above the 20 SMA on the 4H timeframe expecting a potential dip to the zone of 97.128 (liquidity zone) and then bounce up to a weekly target of 97.7. This Thesis is INVALIDATED if a candle opens and closes below 97.015. I wish everyone a great trading week. Thank for supporting my publications and trade ideas. Cheers!!!

Is the DOLLAR bullish? Look at the weekly support zone levelsI am trying to figure out what the recent bullish days mean within the overall range.
Please let me know what you think 🙏🏾

DXY forecast From weekly view the DXY is looking bearish at least till 95.123 key level the will see if we get a bullish power as the DXY is forming a reversal pattern. But of course many factors plays part in this economy, for example, global news like Tariffs and other factors.
So when DXY is trading on the 95.123 key level additional confluence will give us the right to put on trades, as the 95.123 key level is significant for what will take place next.
Take you all.......

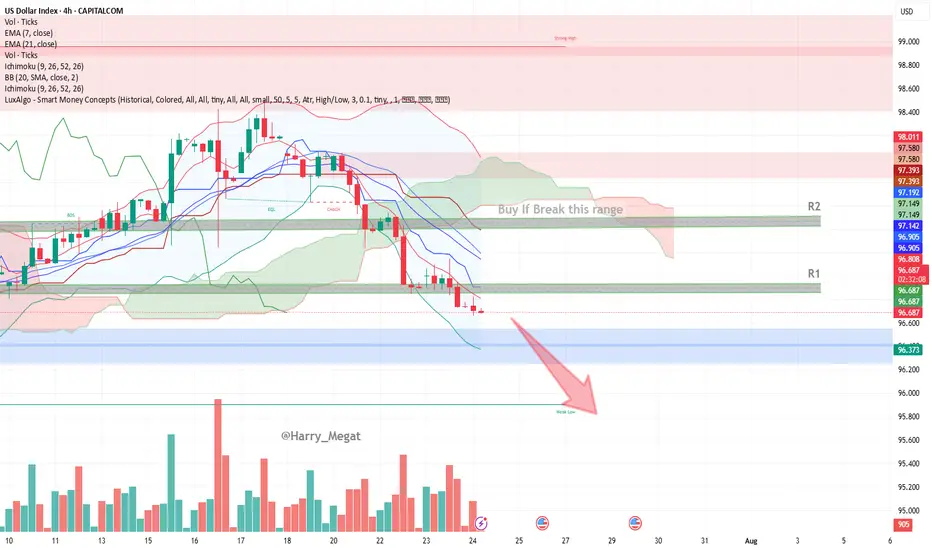
US Dollar Index (DXY) – 4H Chart AnalysisUS Dollar Index (DXY) – 4H Chart Analysis
**Current Trend:** Bearish
Price trades below EMAs, Ichimoku Cloud, and within a bearish channel.
#**Bearish Scenario (Favorable)**
* **Conditions:**
* Price remains below EMA 7 & 21
* Stays under Ichimoku Cloud and 96.812 resistance (R1)
* Lower lows forming, bearish momentum increasing
* **Confirmation:**
Break below **96.37 (blue zone)**
* **Target:**
* TP1: 96.00
* TP2: 95.60 (next weak support)
**Bullish Scenario (Reversal)**
* **Conditions:**
* Price must break above **96.81 (EMA 7 + resistance)**
* Break above **R1 → 96.90**, and then above **R2 → 97.14–97.19**
* Bullish candles close above the Ichimoku cloud
* **Confirmation:**
Break and retest of **97.20**
* **Target:**
* TP1: 97.39
* TP2: 97.58 (key structure)
* TP3: 98.00 (major resistance)
**Bias:** Bearish unless DXY breaks above **97.20** with strong volume and bullish structure.
USD Rallies into a Major Week - Fed, PCE, NFP on the WayReversals of long-term moves can be tough to work with, especially for shorter-term traders.
While fundamentals are important for shaping future price moves and technicals are key for explaining past moves, while also allowing for strategy and risk management, it's sentiment and positioning that probably matter more.
Because if any and everyone in the world that wants to be long already is, well it doesn't matter how positive the news is if there's simply nobody left to buy. And if there's no influx of fresh demand, and only incoming supply, well, then price can drop, even on good news. And at that point, a heavy one-sided market will take notice of falling prices even in the face of good news, when price should be going up, and they'll be disconcerted to hold long positions, which can lead to even more supply, more selling, and in-turn, lower prices.
As the old saying goes, if a market doesn't rally on good news, well then look out below.
This shows in various ways on varying time frames in numerous markets but from a longer-term perspective, that shifting trend is akin to turning a cruise ship in the middle of the ocean - it's not going to happen suddenly. It takes time, it takes shifting, and it takes the slow grind of late-to-the-trend bulls turning into ahead-of-the-curve sellers.
This is what allows for the build of wedges, just as I had looked at earlier in the month in both USD and EUR/USD. Bulls suddenly get shy as prices approaches highs, although they remain aggressive on pullbacks and tests of support. This leads to a weaker trendline atop the move and, eventually, unless buyers get motivated to punch up to higher-highs with a new breakout, that motive for profit taking can soon take over.
In the USD, the sell-off in the first half of this year was a grinding matter, and the polar opposite of the trend that had held in DXY as we came into 2025. But, now the question is whether resilient US data leads to profit taking from bears and as we saw again last week, sellers have been showing lacking motivation at tests of lows or around support.
The big question for this week is whether we see that shift take-hold on a larger basis. We've seen sellers getting shy around lows, but are buyers ready to punch up to fresh highs in the USD? There's certainly ample potential for motivation as given the economic calendar with FOMC, Core PCE and NFP in the final three days of this week. - js
DXY index moving towards down in higher timeframeAs you can see DXY index is moving inside channel and now its time for second swing failure to go down.Then channel movement will finish and it will breakout towards upward so i recomand trade USD pairs accordingly.This is my analysis not a financial advice so trade according your risk management.
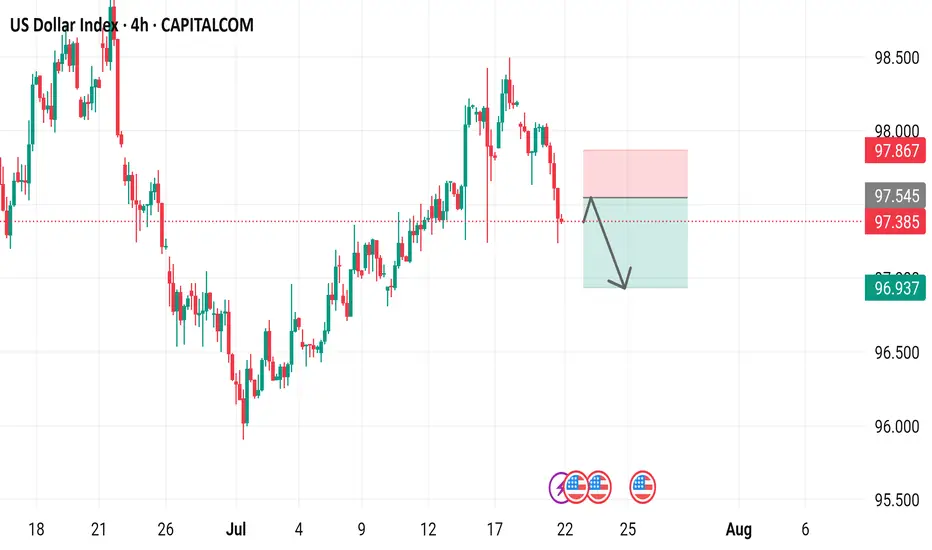
US Dollar Index 4-hour time frame, showcasing the US Dollar Index's performance over this period.
- The index is currently at 97.385, with a decrease of 0.636 (-0.65%) from its previous value.
- A red box indicates a "SELL" signal at 97.385, while a blue box suggests a "BUY" signal at 97.439.
- The chart includes various technical indicators, such as moving averages and relative strength index (RSI), to help traders analyze market trends.
DXYThe U.S. Dollar Index (DXY) continues to exhibit a bearish outlook driven by a combination of technical weakness and shifting macroeconomic fundamentals. Market expectations for Federal Reserve rate cuts, coupled with softer U.S. economic data and declining demand for the dollar as a safe-haven asset, have weighed heavily on the index. Technically, the DXY remains below key moving averages, with momentum indicators showing sustained weakness. Unless there is a significant shift in sentiment or a surprise in monetary policy direction, the bias remains to the downside over the near to medium term.
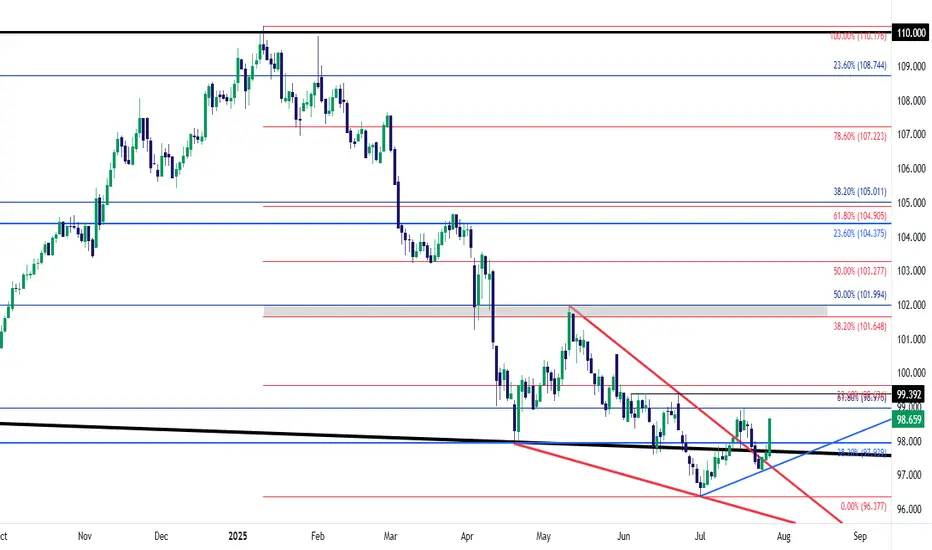
USD Snapback - Long-Term Trendline Back in-PlayThe trendline that originated in 2001 and connected to the 2020 high came in to hold the lows in July of 2023, and then again on Easter Monday. That level also held as support in June albeit temporarily, as bears grinded a sell-off into the Q2 close.
In early-Q3 trade, that trendline was resistance on a few different occasions, until buyers could eventually take it out. And then last week, on the heels of Trump's threat to fire Jerome Powell, price hurriedly pulled back until, eventually, support arrived via that same trendline projection, which is shown in black on the chart.
Now that trendline is back in-play as a test of today's lows. Given the persistent failure from USD bulls to fire anything more than a pullback, combined with the very clear push for USD-weakness from the current administration, it can be difficult to muster a bullish fundamental bias. But - this move had become very one-sided with that sell-off in the first-half of the year so the way that buyers respond to these support tests will be key for whether or not the currency can finally show a reversal theme for more than a couple of weeks. - js

USD Weakness Ahead (3-Month Outlook)EUR/USD: Breaking 1.0850, next target 1.1000
GBP/USD: Cleared 1.2750, heading toward 1.2950
AUD/USD: Rebounded from 0.6650, potential 0.6850
NZD/USD: Above 0.6150, could reach 0.6300
Key Drivers:
1. Fed likely cutting rates before ECB/BoE/RBNZ
2. Commodity recovery (helps AUD/NZD)
3. Political risks weighing on USD
Market Mood:
- Traders reducing long USD positions
- AUD/NZD shorts getting squeezed
Risks:
US inflation surprises upside
Geopolitical shocks boost USD safe-haven demand
Sasha Charkhchian

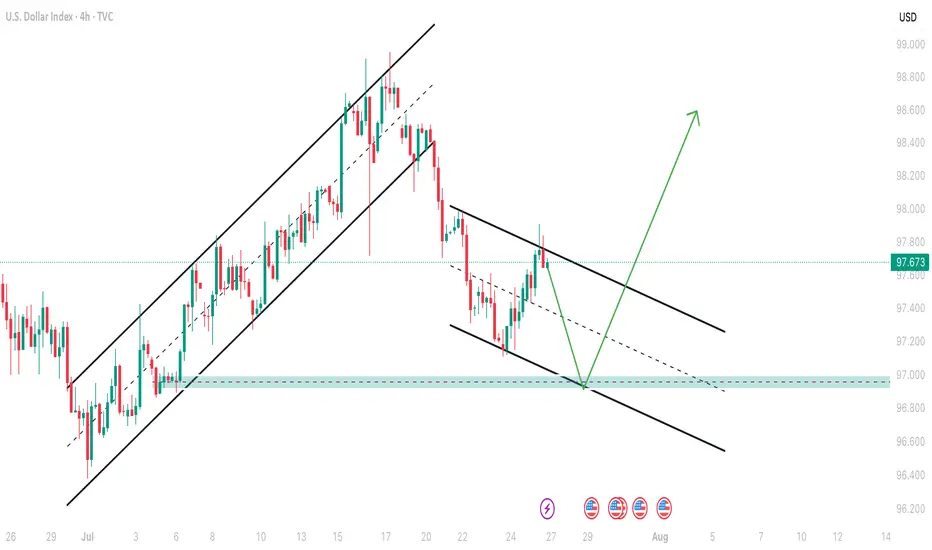
Breakout of the channelAfter the DXY broke out of the channel, it formed a range.
We can see a yellow trendline where the price is moving exactly along it.
If this trendline breaks to the downside, we can take a short position targeting the bottom of the channel.
Otherwise, it would mean the trend reversal in DXY is confirmed.

DOLLAR DXY dollar index on monthly support and we are watching the price action.lets watch the price action.
#dollar

Is the DXY finally changing its trend?It seems that the DXY is showing a tendency to change its trend, but we have to see whether the sellers will allow it or not.

DXY DAILYI see the dollar index trend still bearish
Of course, this is on a daily time frame!
In this event, the value of stock indices (Dow Jones, etc.) will increase
It will also have a direct impact on major pairs
I hope you are successful in your trading😊

DXY SHORT?
## 📉 **DXY Bearish Setup for 2025 – Fed Cuts, Fiscal Strain, Technical Breakdown**
### 🧠 Thesis
The U.S. Dollar Index (DXY) is poised to remain under pressure through the rest of 2025 due to macro, policy, and technical headwinds. With the Fed preparing for multiple rate cuts, rising fiscal imbalances, and a strong global diversification away from USD, the broader trend points **downward**.
---
### 🔍 Fundamentals Driving USD Weakness
* **Federal Reserve Pivot**: 2–3 rate cuts expected in 2025 → erodes USD yield advantage.
* **Surging U.S. Deficits**: Debt-to-GDP nearing 130%, undermining investor confidence.
* **De-dollarization Trend**: Central banks diversifying reserves (yuan, gold, euro).
* **Political Noise**: Tariff risk + weak-dollar narrative from Trump camp adds pressure.
---
### 📊 Technical Outlook (1D/1W Charts)
* DXY is trading below **9/20/50 EMA**.
* RSI \~43 with hidden bearish divergence.
* Clear **descending channel** since mid-2024.
* Key **support zone: 97.90 – 96.40**.
* Below 97.90 opens path toward 96.00–95.00.
---
### 🛠️ Trade Setup
| Type | Short (swing/position) |
| -------- | ---------------------- |
| Entry | Break below 98.00 |
| Target 1 | 96.40 |
| Target 2 | 95.00 |
| SL | Above 99.50 |
| R\:R | \~2.5:1 |
---
### ⚠️ Risks
* Surprise inflation → Fed pauses cuts
* Safe haven bid from geopolitical shocks
* Strong upside breakout >101.00 = trend invalidation
---
### 💬 Final Note
As long as DXY remains below 99.50, rallies are selling opportunities. Watch the 97.90–98.00 level — a confirmed breakdown could mark a fresh leg lower toward 95.00 by year-end.
---
### 🏷️ Tags
`#DXY` `#USD` `#DollarIndex` `#Forex` `#Macro` `#Bearish` `#TradingSetup` `#ShortUSD`
---

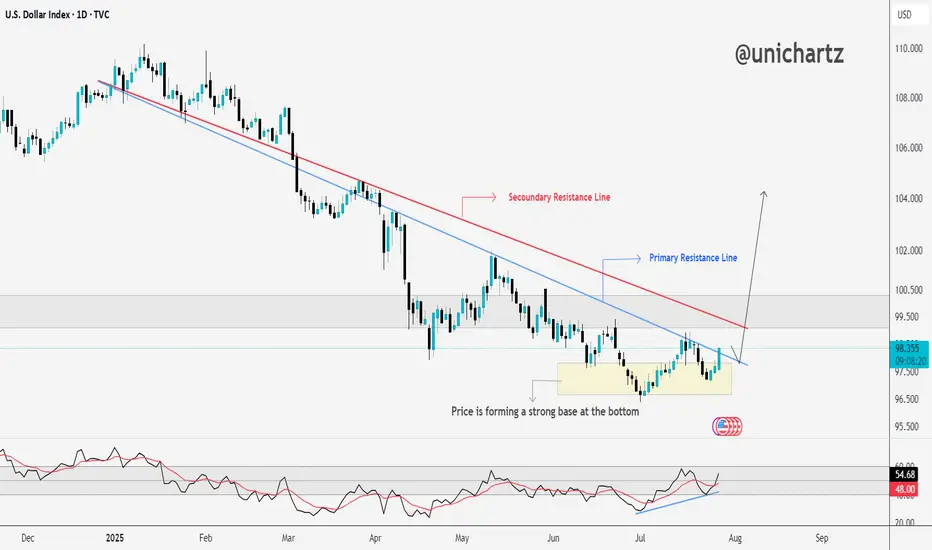
DXY Approaching Key Resistance — Trend Reversal Ahead?The DXY is forming a strong base at the bottom, showing clear signs of accumulation after a long downtrend.
Price has started pushing upward and is now approaching the secondary resistance line. A breakout here could open the path toward the primary resistance zone, which has capped rallies in the past.
The RSI is also trending higher, supporting this potential move.
If bulls clear the red resistance line, momentum could accelerate quickly.
DYOR, NFA
Dollar Index (DXY): Possible Reversal | Inverse Head & ShouldersThe dollar has had a tough year, but that might be changing.
I’ve spotted a well-known reversal pattern: an Inverse Head & Shoulders.
This pattern features three dips, with the middle one—the "head"—being the deepest.
Now, the price has rebounded from the Right Shoulder and is heading higher.
It’s approaching the Neckline at $98.7, which needs to be broken for a bullish confirmation.
If that happens, the projected target is around $101.6, based on the depth of the pattern.
This lines up closely with the previous high of $102 from May. The target area is highlighted in the blue box.
However, if the price falls below the Right Shoulder’s low at $97.1, the pattern would be invalidated.
Anyone else see this pattern?
Could this be the bottom for the dollar?

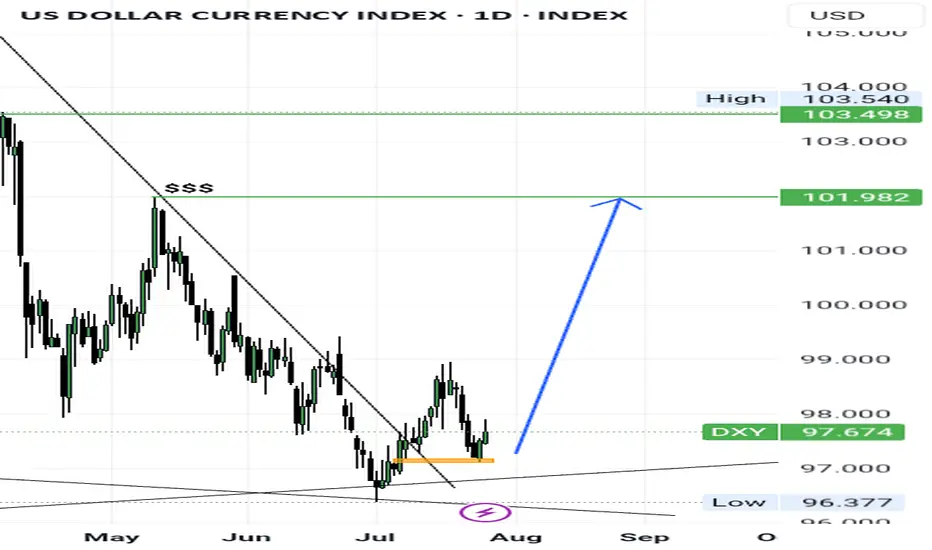
DXY Outlook: Can Fed Hold Spark a Move Toward 100?DXY Weekly Forecast – July Week 4
After reaching 96.50 early this month, DXY began showing bullish signs. Last week, price retested the extreme demand zone at 97.00 and closed with a bearish weekly candle that held some bullish pressure at the base.
This week, all eyes are on the Federal Reserve meeting. If the Fed holds rates steady, the dollar could strengthen further. A weekly close above 97.90 would confirm the breakout and open the door to a run toward 100.00 — a key psychological and technical level.
Bias: Bullish (if 97.90 breaks)
Key Zones:
• Demand: 97.00
• Breakout Level: 97.90
• Target: 100.00
This could be the beginning of a fresh bullish leg — especially if macro conditions align with technical structure.
—
Weekly forecast by Sphinx Trading
Let me know your bias in the comments.
#DXY #DollarIndex #ForexForecast #SphinxWeekly #SmartMoney #FOMC #USD #InterestRates

Dollar indexDollar index in deep discount
Looking for higher prices this month
This my idea not a signal
#ICT