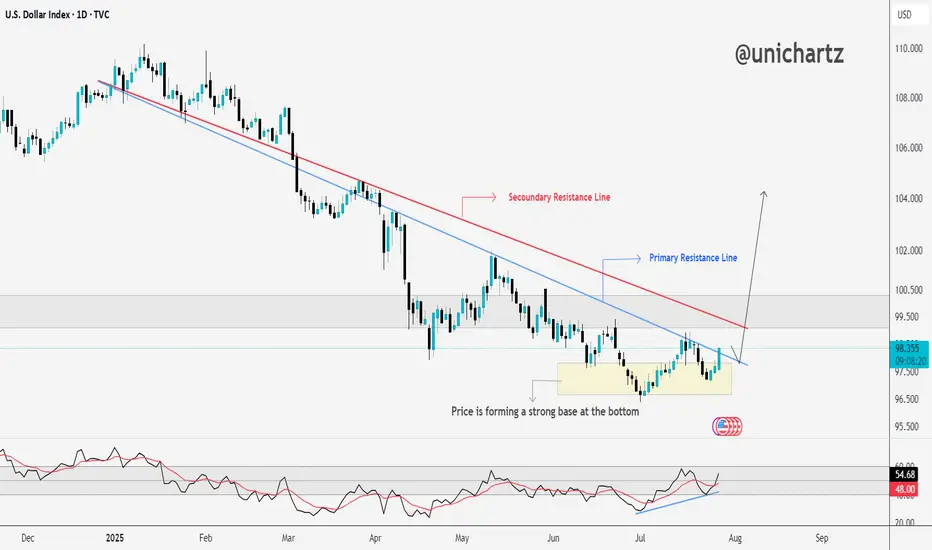
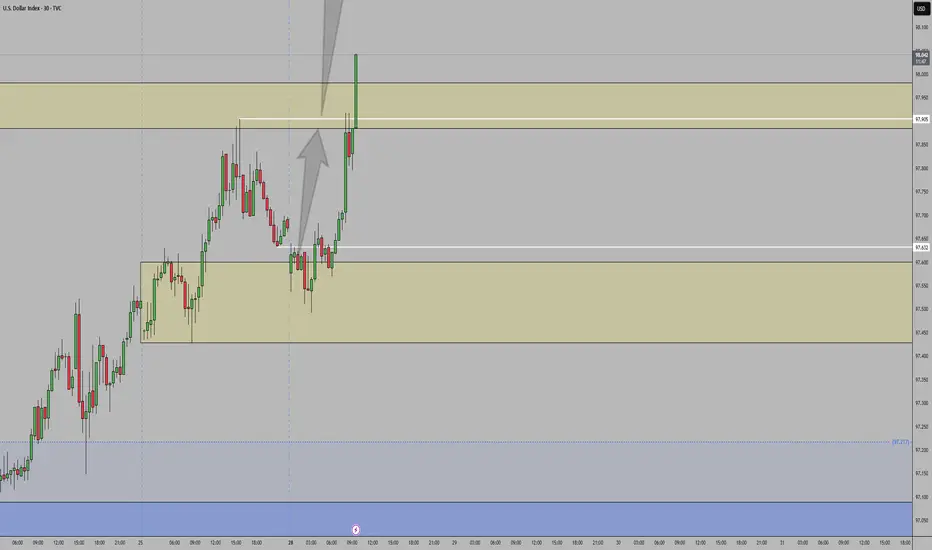
DXY Approaching Key Resistance — Trend Reversal Ahead?The DXY is forming a strong base at the bottom, showing clear signs of accumulation after a long downtrend.
Price has started pushing upward and is now approaching the secondary resistance line. A breakout here could open the path toward the primary resistance zone, which has capped rallies in the past.
The RSI is also trending higher, supporting this potential move.
If bulls clear the red resistance line, momentum could accelerate quickly.
DYOR, NFA
USDX trade ideas
DXY Outlook: Can Fed Hold Spark a Move Toward 100?DXY Weekly Forecast – July Week 4
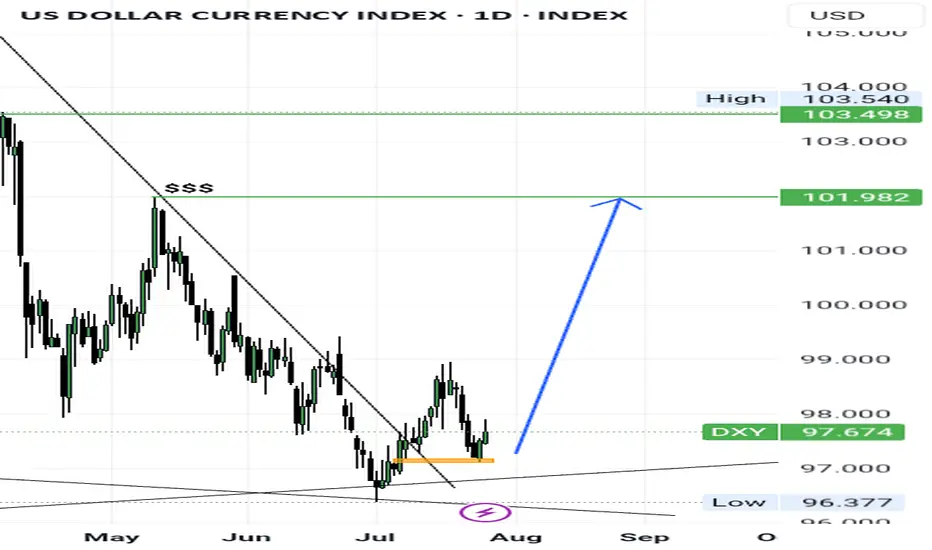
After reaching 96.50 early this month, DXY began showing bullish signs. Last week, price retested the extreme demand zone at 97.00 and closed with a bearish weekly candle that held some bullish pressure at the base.
This week, all eyes are on the Federal Reserve meeting. If the Fed holds rates steady, the dollar could strengthen further. A weekly close above 97.90 would confirm the breakout and open the door to a run toward 100.00 — a key psychological and technical level.
Bias: Bullish (if 97.90 breaks)
Key Zones:
• Demand: 97.00
• Breakout Level: 97.90
• Target: 100.00
This could be the beginning of a fresh bullish leg — especially if macro conditions align with technical structure.
—
Weekly forecast by Sphinx Trading
Let me know your bias in the comments.
#DXY #DollarIndex #ForexForecast #SphinxWeekly #SmartMoney #FOMC #USD #InterestRates

Dollar indexDollar index in deep discount
Looking for higher prices this month
This my idea not a signal
#ICT
DXY Outlook – From Bias to Execution Previous day closed bearish from a known supply leading to a sell bias, On the 45M, I am currently looking out for possible entry or exit.

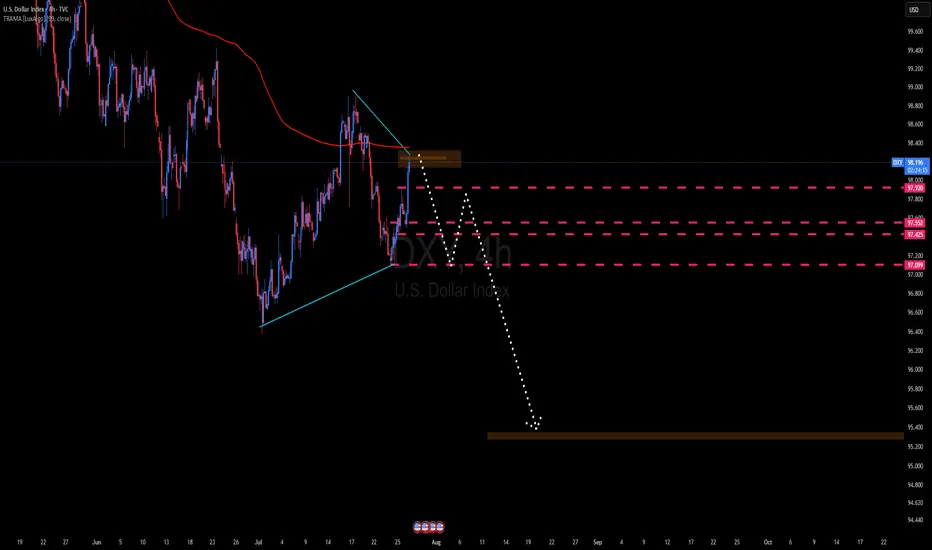
DXY – The Trap Is Set. The Drop Is Coming.Wave structure complete.
Retail thinks we’re going up. I know where it’s really going.
This is GreenFire Execution, not prediction.
🧠 Final liquidity hunt possibly toward 98.76 or even 101.40, then lights out.
Targeting the big liquidity pocket at 95.215
That’s where legends buy while the crowd panics.
📐 Elliott Wave | Wedge Mastery | Market Psychology
If you understand this chart — you don’t need signals. You need silence and execution.
#DXYSetup | #Wave5Ready | #SmartMoney | #ForexMillionaire | #TradingViewElite

DXYTHE DOLLAR INDEX .
key data report ,22nd the fed chairman Powell speaks and on 24th we are expecting Unemployment Claims.
watch this data as they will shape the trade directional bias.
Key Factors Behind Today's Drop
1. Rising Global Risk Appetite and Strong Foreign Currencies
Investors are showing increased appetite for non-dollar assets today. The euro, yen, and pound have all strengthened—most notably, the dollar fell nearly 1% against the yen after political developments in Japan and a positive outlook in Europe.
European optimism was boosted by encouraging business survey results, while political clarity in Japan lifted the yen and added further selling pressure on the dollar.
2. Lower U.S. Treasury Yields
Softening U.S. yields contributed to the dollar’s weakness. Lower yields typically make the dollar less attractive relative to other currencies, further encouraging outflows.
Investors are reassessing Federal Reserve rate cut odds and show caution ahead of the July 31 Fed meeting.
3.Uncertainty Over Tariffs and U.S. Policy
Heightened anxiety around upcoming U.S. tariffs (with an August 1 deadline) and erratic policy signals are dampening confidence in the dollar as a safe haven.
Speculation over Fed independence, including market chatter about potential challenges to Chair Powell’s role, has hurt trust in U.S. monetary policy stability, fueling additional dollar selling.
Conclusion
The dollar index’s drop from its ascending trend line today is the result of a perfect storm of increased foreign currency strength, risk-seeking investor sentiment, declining U.S. yields, persistent policy and tariff uncertainty, All of these factors have combined to drive sellers selling momentum ,they will continue to push the index to its lowest levels and my structure is giving me 94-94.5 level.
trading is 100% probailty,trade with caution.

DXY Bearish Breakout! Sell!
Hello,Traders!
DXY is trading in a strong
Downtrend and the index
Made a bearish breakout
Out of the bearish flag pattern
So we are bearish biased
And we will be expecting
A further bearish move down
Sell!
Comment and subscribe to help us grow!
Check out other forecasts below too!
Disclosure: I am part of Trade Nation's Influencer program and receive a monthly fee for using their TradingView charts in my analysis.

DXY at Its Most Critical Level of 2025 — Will the 100 Bank LevelThe Dollar Index (DXY), just like several other majors, is approaching a very important level. We’re now near the 100 mark, which is not only a psychological level — but also a key institutional (bank) level.
There’s also a gap zone left behind that price is about to fill. I believe the index will stay in a range over the next 1–2 days as it waits for critical data later this week — especially Wednesday’s announcements and Friday’s NFP report, which could set the tone for what’s next.
Based on current market sentiment, Trump’s remarks, Powell’s upcoming speech, and broader macro factors, I believe DXY has the potential to break above 100 and move toward 102–104, if that level is broken cleanly.
Let’s also not forget — price bounced from a monthly demand block near 96, and we’re seeing weak support across majors like EUR and Gold. That adds confluence for potential dollar strength.
📌 What do you think — is dollar strength just around the corner?
🔁 This analysis will be updated whenever necessary.
Disclaimer: This is not financial advice. Just my personal opinion.
DXY FOMC FORECASTCristal Clear structure to me, dolar down today before FOMC and then up wild
Levels highlighted
Najors Gold and Cryptos will follow the same behavior
GG
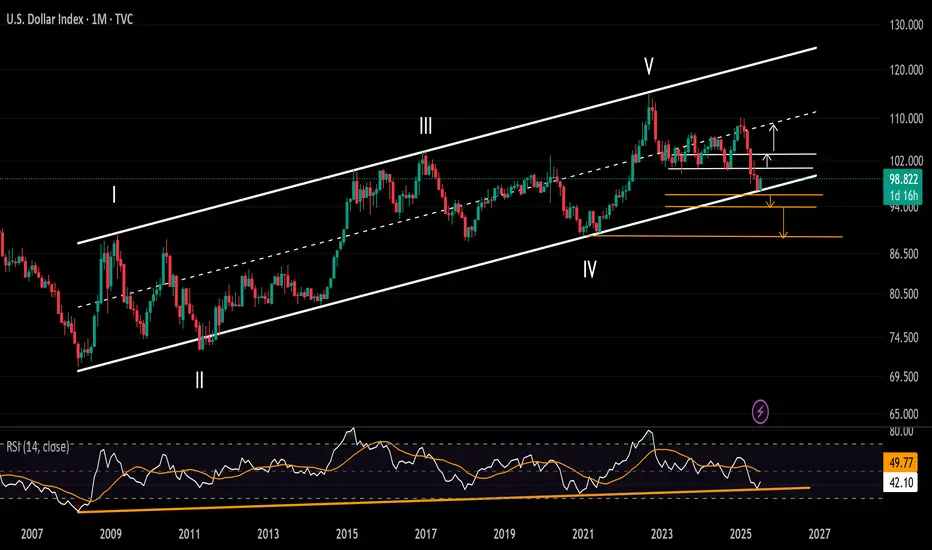
DXY warning of an incoming bear market?The DXY is into major multifactor support on the weekly timeframe. We have 2 weekly trendlines intersecting right at the 97.00 level. The first connects the highs from March 2020 through the lows of July 2023 to where we are now. The second is much larger and goes all the way back to 2007, connecting the lows from 2007, 2011 and 2021. We could see a major bounce here for months and some companies have reported during earnings that the sole reason for their improved earnings was due to weakness in the dollar. What happens to earnings when the DXY goes back into bull mode???? Time will tell...

DXY - ABC Move still in playDXY has been moving not so much on technical factors lately but more so with what Mr. Trump says, we still could see a move lower with an ABC pattern.
Good Luck

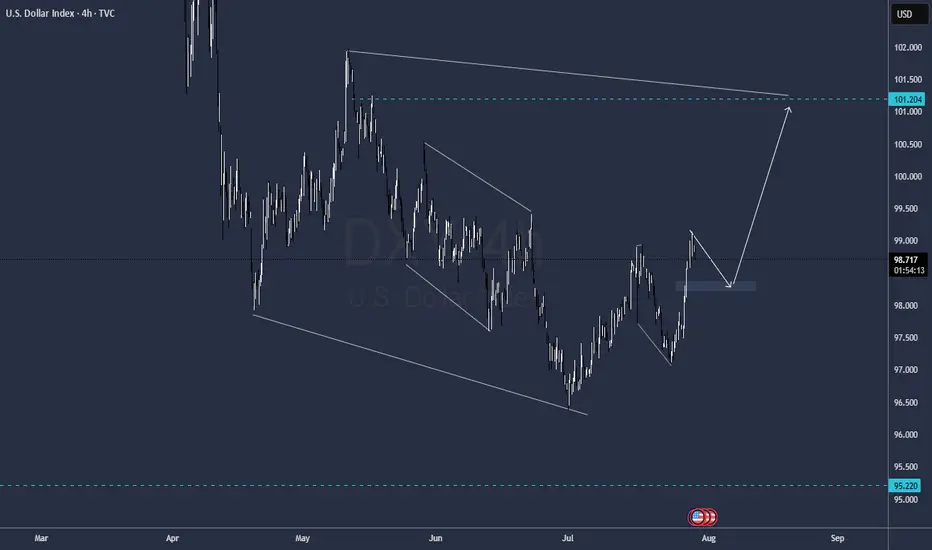
DXY 4Hour TF - July 27, 2025DXY 7/27/2025
DXY 4hour Bearish Idea
Monthly - Bearish
Weekly - Bearish
Dailly - Bearish
4hour - Bearish
**We analyze DXY as an indicator of USD strength on a week to week basis**
This week is looking like we can expect bearish momentum on USD but here are two scenarios breaking down the potential:
Bearish Continuation - USD pulled a strong bearish reversal all last week which pushed us below our major 98.000 support zone.
We are now testing that same 98.000 zone as resistance and are looking to see if it will hold. Ideally, we can confirm further bearish structure to gain confidence in a bearish USD for the week ahead.
Bullish Reversal- For us to consider DXY as bullish again we would need to see bullish structure above our 98.000 zone. This would include: A break back above 98.000 with an established HH and HL.

DXYDXY Bullish COT Setup
Commercials: Net-long ~3,988 → smart money positioning for strength
Large Specs: Net-short ~3,451 → bearish bias, potential squeeze risk
COT Index: 94.5% → near historical extreme, signaling possible trend shift
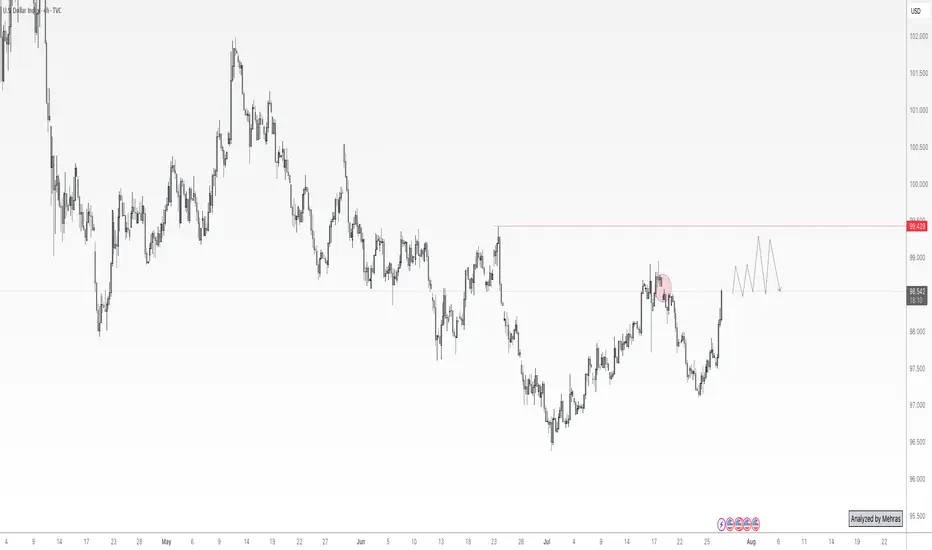
DXY 1D – Tipping Point: News or Price Action?Hey Guys,
The DXY index is currently moving within a downtrend. This trend is unlikely to reverse unless it breaks above the 98.950 level.
Sure, key fundamental data could shift the trend, but without those news catalysts, a reversal at this point doesn’t seem realistic.
Don’t forget—98.950 is a critical threshold for the DXY.
I meticulously prepare these analyses for you, and I sincerely appreciate your support through likes. Every like from you is my biggest motivation to continue sharing my analyses.
I’m truly grateful for each of you—love to all my followers💙💙💙

DOLLAR INDEX U.S. Dollar Index (DXY) and US 10-Year Treasury Yield
Dollar Index (DXY) — will reclaim 103-102 level if it crosses 100 mark currently is at 98.34 and faces immediate supply roof ,a make or break situation awaits dollar buyers .
Over the past month, the Dollar Index has gained about 2%, although it is still down over 5% compared to a year ago. The recent uptick follows a period of volatility and selling, with investors recalibrating expectations after the resolution of trade risk premiums and recent U.S.–EU trade deals.
US 10-Year Treasury Yield keep rising after its drop from 4.193% in early july to 4.5% on 17th
Yield on the US 10-year Treasury note is currently about 4.42% , modestly higher than last week and unchanged from the previous session.
Current levels reflect ongoing uncertainty regarding future Federal Reserve policy moves, cautious optimism regarding U.S. economic strength, and some abatement of safe-haven flows after recent global trade developments.
Relationship & Market Synopsis
DXY and the 10-year yield typically have a positive correlation: When Treasury yields rise, the dollar often follows, as higher yields make dollar-denominated assets more attractive to global investors. Conversely, falling yields can weigh on the dollar. However, in 2025, there have been periods of divergence due to external shocks and policy uncertainty.
Current setup: Both DXY and the 10Y yield are rising modestly, signaling a shift to a more constructive tone for the U.S. dollar as risk sentiment stabilizes and investors scale back some safe-haven trades. Recent U.S. economic resilience and fading tariff fears have reduced the need for defensive flows, supporting both yields and the dollar.
Forward outlook: Market consensus expects limited further upside for Treasury yields unless there are strong surprises in U.S. data or Federal Reserve communication. The DXY is projected to stabilize near current levels or drift higher on persistent U.S. economic momentum.
Summary:
Both the Dollar Index and US 10-year Treasury yield are modestly higher as of July 29, 2025. Their positive price action reflects improving US growth prospects, reduced global risk premiums, and recalibrated market expectations on Fed policy. While their relationship is generally positive, periods of divergence have occurred in 2025 due to trade, policy, and economic shocks. Currently, both are showing moderate gains as investor sentiment stabilize

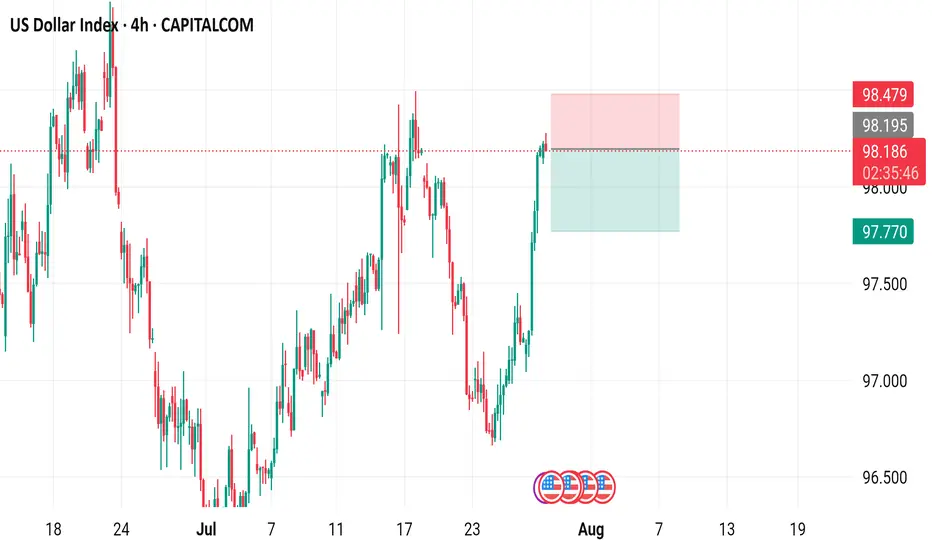
US Dollar Index (DXY) - 4 Hour Chart4-hour chart from CAPITALCOM displays the recent performance of the US Dollar Index (DXY), showing a current value of 98.190 with a slight decline of 0.009 (-0.01%). The chart highlights key price levels, including a recent sell signal at 98.189 and a buy signal at 98.243, with a resistance zone marked between 98.195 and 98.479. The index has experienced fluctuations, with notable drops and recoveries, and is currently trending near the 98.190 level as of July 29, 2025.

DXY bullishDXY is in the early stage of a bull market, so no one want dollars but in my view but the trend is your friend.
This could be a impulsive 5 of 5 or a B of ABC but both are bullish, another view is that the EURO have been a bad day when the US and EU reach tariff agreement??
The lagging indicators are changing or I hope, but this bullish trend for the Dollar could continue for weeks...

DXY Bearish Trend The DXY is expected to enter a bearish phase, with a potential decline starting from the 98.26–98.35 range, and possibly extending down to the 95.20–94.50 levels, which are anticipated to act as key support zones during the upcoming downtrend
DXYJULY 21-25 recap
Net was -296 last week
Price dropped until Wednesday
Hit the weekly demand zone (strong support)
Sellers paused or covered shorts there
Buyers stepped in → possible bounce or reversal

US Dollar Index - 4h Chart (CAPITALCOM)4-hour chart of the US Dollar Index (DXY) from CAPITALCOM shows the index's recent price movements. The current value is 96.955, with a slight increase of 0.054 (+0.06%). Key levels include a support at 96.413 and resistance at 97.554. The chart highlights buy signals at 97.012 and sell signals at 96.958 and 96.955, with a notable downward trend breaking below a support zone around 97.150.

DXY Surge Pressures Currency Market in Volatile Market WeekThe US Dollar Index (DXY) has held its rebound off historical support zones on both the price chart and the RSI indicator throughout July. The monthly RSI is bouncing off a support line extending between the troughs of 2008 and 2020. Meanwhile, price action is rebounding from a support trendline that connects the lows of 2008, 2014, and 2021, within the 96–94 zone.
Bearish Scenario: A solid close below this support zone may confirm a long-term bearish signal, potentially pushing the index toward the 94 and 90 levels.
Bullish Scenario: A confident move above 100 and 103 could signal a reversal in the currency market, potentially leading the DXY back toward the mid-range of the long-standing channel between 105 and 107, originating from the 2008 lows.
Written by Razan Hilal, CMT
FX Matrix: Dollar Index, GBP/USD & EUR/USDDollar Index : 99.394, 100.425 - 100.690
Euro: 1.14855 - 1.14477
GBP: 1.31643 - 1.31453
