Go Long on VIX Amid Elevated Market VolatilityKey Insights: The current market scenario is characterized by significant
volatility due to geopolitical tensions and economic uncertainties, making
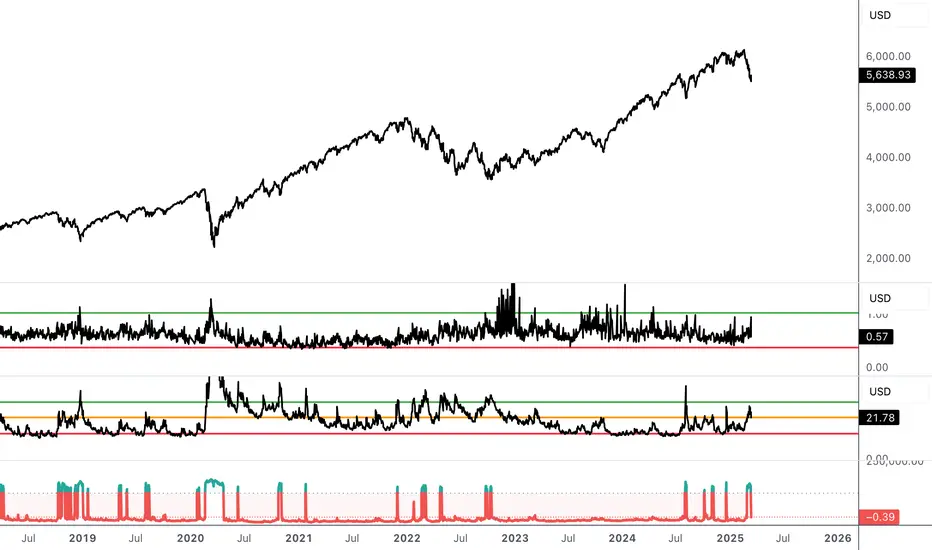
the VIX an essential indicator for investors. With the VIX priced at 21.77,
close attention should be paid to support and resistance levels, as a breach
could provide actionable trading signals. Maintaining a long position on the
VIX could be advantageous amidst ongoing market instability and the
potential for further fluctuations.
- Price Targets: For those considering a long position, the following targets
and stops are recommended next week:
- Target 1 (T1): 22.60
- Target 2 (T2): 23.50
- Stop Level 1 (S1): 21.20
- Stop Level 2 (S2): 20.60
- Recent Performance: The VIX has experienced heightened activity recently,
reflecting the market's sensitivity to various risk factors, including
geopolitical issues and tech market fluctuations. The current level near
21.77 points towards a phase where volatility remains above average,
suggesting ongoing investor concern.
- Expert Analysis: Market experts suggest maintaining vigilance in the face of
potential volatility spikes. The consensus indicates that despite recent
fluctuations, there is cautious optimism for relief rallies. Taking a
strategic and disciplined approach amid the current market conditions is
suggested, focusing on long-term quality assets while using the VIX as a
barometer for short-term volatility.
- News Impact: The pending FOMC meeting stands as a significant event that could
influence market volatility levels. Geopolitical developments and economic
data releases, such as retail sales, are also set to impact market dynamics.
Notably, volatility in tech stocks and companies like Tesla demonstrates
market sensitivity to external events, highlighting the importance of the
VIX as an indicator under current market conditions.
VIX trade ideas

Thoughts on a Saturday morningAMEX:SPY and NASDAQ:QQQ still have not broken above their respective ranges yet. Indicators on both futures and the VIX are warning bulls not to count the chickens too soon.

Long S&P 500 Three signals have been hit:
1. The equity put call ratio has reached a value of 0.94 this week, further indicating a potential bottom in sentiment.
2. The Vix has spiked above 30 and is beginning to stabilize below 25.
3. The front month and three month Vix futures backwardation has stabilized.
This Friday, AMEX:VOO recorded a 2% gain. Therefore a long can be taken on Monday close with a stop loss placed below the Friday low.
VIX and The BUY SIGNAL for The SP 500 is being Given The chart posted is the VIX index > we are now outside the bands and we could see a minor new low in the sp if the wave structure is the alt . This would give us a supper bullish signal one that would huge . I took minor gains and will re position if I can get that last move to trap the shorts have great weekend I am looking for 3 up weeks in a row

$VIX daily golden crossTVC:VIX is attempting to hold above the lower MAs, hold it’s golden cross on the daily. The next resistance is much much higher, if it bounces and pushes through yesterday’s resistance.

14 th is the turning pointThis channel is not providing individualized trading or investment advice, nor is it a banking service, brokerage service, trading service, investment service or money management service.

VIX PARABOLIC means MAJOR DROP, we are on that zone now.
After VIX's massive breakout this past few weeks -- rendering the market helpless bringing forth a bleeding season, VIX is bound for a major drop after tapping a strong resistance level.
That parabolic move should warrant a weighty trim down ahead in the next few weeks.
Expect markets across the board, from equities/crypto/fx majors/gold to bounce big from here on.
Ideal opportunity to enter here relative to your preferred asset to trade.
Spotted at 27.85
Interim target 20.0
Mid Target 15.0

VIX & Seasonality shift S&P 500Based on seasonal data mid to late March marks a positive shift for the S&P 500.
VIX has held above current trend to aid the latest correction on the S&P 500.
A clear break below the trend line on the VIX could offer a significant opportunity for a counter trend rally before markets continue downwards.

VIX...Man did I get lucky or were cycles just dead on??make sure to apply and not apply the Log to see trends on different scaler pattern
see previous post, but here is the updated chart with Demark sequential notation on the bars

A tradable bottom? AMEX:SPY TVC:VIX analysis
Maybe a tradable bottom today after the numbers. Good day to wait and see what happens.....

Direct relationship between JAP 10 year yield and VIX?With reference to my previous posts on the inverse relationship between the VIX and USBTC, I want to give another instrumental relationship to monitor the trend of VIX in order to get some clues on the inverse trend of USBTC through that.
The 10 year Japanese Gov. yield is in direct relationship to the VIX, though not too detailed but in line with its trends and major movements. As long we can expect the 10yJAP to increase - as it can be predicted right now due to rising inflation in Japan - we can expect the VIX as well to be elevated or rising. A break of the 10yJAP trend can be indicative of a change in the trend of the VIX and USBTC as well.

Harmonic Potentials On SPY & VIX Signal Huge ReversalUsing a harmonic pattern detection script developed by reees alongside RSI with a 15 minute timeframe, we see that AMEX:SPY has a huge upside potential to ~$588 while the TVC:VIX is showing that it has a high chance to sell off. With the RSI break above its moving average for AMEX:SPY and below the moving average for TVC:VIX , the patterns potential completion is strengthened. Usually, based on historical data, when both these instruments show an anti-symmetric pattern potential, it typically has a high chance of succeeding and reaching the potential price zone.

Wait for the $19 before buying thisThis channel is not providing individualized trading or investment advice, nor is it a banking service, brokerage service, trading service, investment service or money management service.

Backwardated Volatility Curve: A Thesis on Fear and OpportunityWhen the ephemeral grip of fear tightens, it often manifests as a divergence in the volatility landscape. Specifically, when the immediate dread, captured by spot VIX, surges beyond the horizon of longer-term anxieties, represented by VIX 3M, a unique market condition arises: the inverted, or backwardated, volatility term structure.
Beyond a mere statistical anomaly, this phenomenon paints a vivid portrait of market psychology. The thesis posits that such an inversion reflects a market bracing for immediate shocks, a perception of heightened risk that overshadows longer-term outlooks. In essence, fear is front-loaded.
The implications are profound. This surge in short-term implied volatility, driven by a desperate scramble for immediate protection via options, can trigger dramatic price swings. In its heightened state, the market often succumbs to panic, driving asset prices lower. Yet, the contrarian thesis finds its footing in this very panic, this acute manifestation of fear.
The core argument rests on the dichotomy between panic and fundamentals. While short-term volatility spikes may reflect a visceral reaction to immediate threats, the longer-term view, as expressed by VIX 3M, suggests a belief in the eventual dissipation or moderation of these uncertainties. Thus, the inversion becomes a signal, a potential harbinger of near-term capitulation.
Historically, when spot VIX eclipses VIX 3M to levels associated with market troughs, astute observers recognize an opportunity. The logic is compelling: once the immediate storm passes, spot VIX should revert, realigning with or falling below VIX 3M. This normalization and the potential for a stock market rebound form the basis of the contrarian play.
The underlying principle is that volatility, by its nature, exhibits mean reversion. Extreme deviations, such as a significantly elevated spot VIX relative to longer-term measures, are often unsustainable. The expectation is that volatility will normalize, paving the way for market stabilization or a resurgence.
However, a critical caveat remains. The backwardated curve is not a panacea. It can reflect genuine, persistent risks. Major unforeseen events can sustain or even amplify the inversion. Therefore, a contrarian stance is inherently risky.
Yet, for those who believe in the market's tendency to overreact, the inverted volatility curve transcends a mere threat. It becomes an opportunity, a moment where the market's fear, though palpable, may be fleeting, paving the way for potential gains. This thesis invites a nuanced perspective, urging traders to discern between transient panic and enduring risk and to recognize the potential for opportunity within perceived chaos.

Vix Showing us Relief Ahead? The market volatility has taken a toll on many emotions over the last 2 weeks as we have broken many records for fear, panic, and short interest in the market. It is very clear that this drop has spooked many market participants out of their positions.
However, statistics do suggest that these opportunities generally lead to rallies as the market reaches extreme oversold conditions.
Above, I have illustrated a potential Bearish Harmonic pattern, with the key fibonacci retracement levels marked on the pivots. The VIX chart illustrates the nature of the Call / Put relationship, by representing panic levels above 20.
As we can see , this harmonic pattern would suggest that a rally may be coming in the near future as panic begins to decline, or as the short traders start getting squeezed out of the market.

Market Sell-Off! Tech Giants TSLA & NVDA Crash Overall Market Sentiment: The market exhibited notable declines across major technology stocks and the broader S&P 500 ETF (SPY). High trading volumes accompanied these declines, particularly in NVDA and TSLA, indicating strong selling pressure. Investors should monitor upcoming economic data releases and earnings reports for potential catalysts that could influence market direction.
Please note that market conditions can change rapidly, and it's essential to conduct thorough research or consult a financial advisor before making investment decisions.
SPDR S&P 500 ETF Trust (SPY):
Current Price: $572.71
Change: -$10.41 (-1.78%)
Intraday Range: $570.13 - $580.12
Volume: 80,094,868 shares
Analysis: SPY experienced a notable decline, closing near its intraday low, suggesting increased selling pressure.
Gamma Exposure (GEX) & Options Sentiment
🔹 Call Walls (Resistance):
610: Key gamma resistance—bulls must reclaim this level for a reversal.
615-620: If 610 is breached, expect resistance at these levels.
🔹 Put Walls (Support):
575-570: Strong negative GEX area, meaning liquidity could dry up if breached.
565: Next major downside target if bears take control.
🔹 Options Sentiment:
IVX avg: 30.3 (4.75% increase) – Implied volatility is rising, signaling uncertainty.
Put Open Interest: 101.6% – A heavily bearish sentiment, indicating risk of continued downside.
Thoughts
SPY needs to reclaim 580 to avoid further selling pressure toward 570-565.
If 570 fails, expect an acceleration lower to 565-560.
Put positioning is extreme, so any squeeze could lead to a fast recovery, but the trend remains bearish.
🔹 Best Trading Plan:
Bullish Play: Watch for a reclaim of 580 → target 598-610.
Bearish Play: Watch for rejection at 580 or a break below 570 → target 565-560.
--------------------------------------------------------
Apple Inc. (AAPL):
Current Price: $235.33
Change: -$0.37 (-0.16%)
Intraday Range: $233.35 - $237.85
Volume: 45,170,419 shares
Analysis: AAPL showed minor losses, trading within a tight range, indicating potential consolidation.
Gamma Exposure (GEX) & Options Sentiment
🔹 Call Walls (Resistance):
240: Key resistance—bulls must break above this for further upside.
250: Highest positive NETGEX area—major breakout zone.
🔹 Put Walls (Support):
230: Strong put support—buyers defended this level.
225-220: If 230 breaks, downside acceleration could occur.
🔹 Options Sentiment:
IVX avg: 36.3 (4.21% increase) – Implied volatility is rising, signaling increased uncertainty.
Call Open Interest: Moderate bullish interest above 240.
Thoughts
AAPL must reclaim 240 to regain bullish momentum toward 245-250.
If 230 fails, expect downside toward 225-220.
IVR is high, meaning a big move is coming—watch for a breakout or breakdown.
🔹 Best Trading Plan:
Bullish Play: Watch for a breakout above 240 → target 245-250.
Bearish Play: Watch for rejection at 240 or a break below 230 → target 225-220.
--------------------------------------------------------
Tesla Inc. (TSLA):
Current Price: $263.45
tradingview.com
Change: -$15.66 (-5.61%)
Intraday Range: $260.02 - $277.88
Volume: 98,451,566 shares
Analysis: TSLA faced significant selling pressure, closing near its intraday low, which may indicate bearish sentiment.
Gamma Exposure (GEX) & Options Sentiment
🔹 Call Walls (Resistance):
280: Key resistance—TSLA needs to reclaim this level for upside.
300: Major breakout zone—bulls need significant momentum to reach this level.
🔹 Put Walls (Support):
250: Strong put wall—buyers may step in here, but a break could lead to further selling.
249.89: If this level is lost, TSLA could drop sharply.
🔹 Options Sentiment:
IVX avg: 84.9 (7.5% increase) – Implied volatility is soaring, meaning a major move is coming.
Call Open Interest: Only 17.3%, showing weak bullish positioning.
Thoughts
TSLA needs to reclaim 265 for bulls to take control.
If 250 fails, expect downside toward 245-230.
High IVR (93.2) suggests a massive move is coming—be ready for volatility.
🔹 Best Trading Plan:
Bullish Play: Watch for a breakout above 265 → target 280-300.
Bearish Play: Watch for rejection at 265 or a break below 250 → target 245-230.
--------------------------------------------------------
Alphabet Inc. (GOOGL):
Current Price: $172.35
Change: -$0.65 (-0.38%)
Intraday Range: $170.25 - $174.81
Volume: 28,301,953 shares
Analysis: GOOGL experienced a modest decline, remaining within its recent trading range.
Gamma Exposure (GEX) & Options Sentiment
🔹 Call Walls (Resistance):
175: Key resistance—bulls must break above this to continue the rally.
180: Stronger call resistance, meaning sellers may defend this level.
🔹 Put Walls (Support):
170: Immediate support—holding for now.
165: Major put support—if broken, selling could accelerate.
🔹 Options Sentiment:
IVX avg: 39.5 (2.5% increase) – Implied volatility is slightly rising.
Call Open Interest: 31.12% at 175, showing a possible breakout level.
Thoughts
GOOGL must break 175 for continued upside toward 180.
If 170 fails, expect a move back to 165-160.
With low put pressure and positive GEX, a breakout seems more likely.
🔹 Best Trading Plan:
Bullish Play: Watch for a breakout above 175 → target 177.5-180.
Bearish Play: Watch for rejection at 175 or a break below 170 → target 165-160.
--------------------------------------------------------
NVIDIA Corp. (NVDA):
Current Price: $110.57
Change: -$6.76 (-5.76%)
Intraday Range: $110.23 - $116.44
Volume: 321,181,861 shares
Analysis: NVDA saw a sharp decline with high trading volume, suggesting strong selling interest.
Gamma Exposure (GEX) & Options Sentiment
🔹 Call Walls (Resistance):
122: First key resistance—NVDA needs to reclaim this for bullish momentum.
130: Stronger gamma resistance, meaning sellers may defend this level.
🔹 Put Walls (Support):
110: Highest negative NETGEX—if this level breaks, a big drop is likely.
105: If selling pressure continues, this will be the next support zone.
🔹 Options Sentiment:
IVX avg: 72.7 (4.83% increase) – Rising implied volatility suggests traders expect big moves.
Call Open Interest: Low at 8.9%, indicating weak bullish positioning.
Thoughts
NVDA must hold 110 to avoid further downside to 105-100.
If 115 breaks, expect a move back to 122-126.
High IVR (51.2) means volatility is increasing—be prepared for a breakout.
🔹 Best Trading Plan:
Bullish Play: Watch for a breakout above 115 → target 122-126.
Bearish Play: Watch for rejection at 115 or a break below 110 → target 105-100.
--------------------------------------------------------
Advanced Micro Devices Inc. (AMD):
Current Price: $98.85
Change: -$2.83 (-2.78%)
Intraday Range: $98.28 - $101.07
Volume: 28,984,978 shares
Analysis: AMD declined moderately, closing near its intraday low, indicating potential continued weakness.
Gamma Exposure (GEX) & Options Sentiment
🔹 Call Walls (Resistance):
$102-$104: AMD needs to clear this range for a bullish reversal.
$105: Larger call interest here—strong resistance if the stock rallies.
🔹 Put Walls (Support):
$100: Major decision point—if this breaks, AMD could drop fast.
$95: Strongest put wall—bears will likely push toward this level if weakness continues.
🔹 Options Sentiment:
IVX avg: 55.8 (4.43% increase) – Implied volatility is rising, suggesting traders are expecting bigger moves.
Call Open Interest: Low at 12.7%, meaning bulls are not yet aggressively positioned.
Thoughts
AMD is at a make-or-break level at $100.
If $100 holds, we could see a bounce toward $104-$105.
If $98 breaks, AMD could drop toward $95-$90 quickly.
High IVR (47.6) signals increasing volatility—expect a breakout soon.
🔹 Best Trading Plan:
Bullish Play: Look for a breakout above $102, targeting $104-$105.
Bearish Play: If $100 fails, short below $98, targeting $95-$90.
--------------------------------------------------------
Meta Platforms Inc. (META):
Current Price: $627.93
Change: -$28.60 (-4.36%)
Intraday Range: $624.31 - $652.99
Volume: 13,446,454 shares
Analysis: META experienced a significant drop, closing near its intraday low, which could signal bearish momentum.
Gamma Exposure (GEX) & Options Sentiment
🔹 Call Walls (Resistance):
$660-$700: Heavy resistance—META needs to clear this for a real bounce.
$720: Stronger resistance, unlikely unless a big rally happens.
🔹 Put Walls (Support):
$620: Short-term support—watch for a reaction here.
$600: Critical zone—if broken, META could free-fall.
🔹 Options Sentiment:
IVX avg: 45.3 (5.26% increase) – Implied volatility rising, indicating traders expect bigger moves.
Put Open Interest: High at $600, meaning downside protection is in place.
Thoughts
META is testing key support at $620—a make-or-break zone.
If $620 holds, we could see a bounce toward $660+.
If $620 fails, META could break down toward $600 or lower.
Options data suggests high volatility ahead—be prepared for a sharp move.
🔹 Best Trading Plan:
Bullish Play: Look for a breakout above $655, targeting $660-$700.
Bearish Play: If $620 fails, short below $620, targeting $600-$580.
🚨 Disclaimer: This analysis is for educational purposes only and does not constitute financial advice. Always conduct your own research and trade with proper risk management.

Greatest Volatility of all times is approaching...#vix the volatility index has been accumulating since covid 2020 crash. In higher time frame, TVC:VIX has broken out in 5th August 2024 and it was just a test!.. Then continued consolidation till this time , also doing the retest. at this zone, accumulation of the 2020 covid crash for a new impulsive wave!..
In lower time frame , several days ago VIX broke out the accumulation zone coming from 5th August and this warns you about your greedy positions my friends. We haven' t seen a real great volatility since covid crash and VIX chart is getting alarming. You' ve been warned. Not financial advice.
Temporary INVALIDATION: If VIX dumps below 13 zone , this will be more secure. Below 10 is the main invalidation.

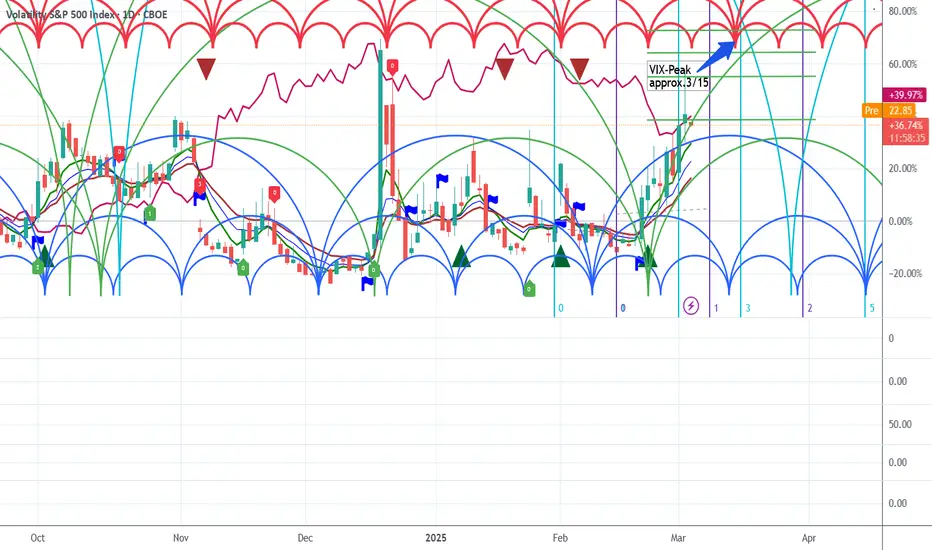
VIX/BTC Relationship up-dateFollowing up on my previous postings on the VIX/BTC relationship and possible conclusions from it on a successful trade, I up-dated my analysis as my personal view on the matter.
From a cycle analysis perspective, we will get a VIX peak around 3/15 to 3/19, which means we will get a BTC trough as well around that time. The VIX might go into the 30th as we have not yet approached the SPX trough, though we might get a bear flag for a few days before it goes down again, bcs the market is oversold.
Conclusions: watch IBIT, MSTR for a short/interm. term successful trade! Stay save ....
Going lower until the 12thThis channel is not providing individualized trading or investment advice, nor is it a banking service, brokerage service, trading service, investment service or money management service.

VIX/USDT.D - Is crypto the next volatility? I like to follow unusual ratios.
I also regularly follow those that make sense for at least a few years.
VIX/USDT.D is one of them.
What I see when I examine the chart actually makes me think that no matter how positive I try to think, there is a high probability of a southward price movement for crypto assets.
I predict that we will see more volatility in crypto assets than in the classical markets in the coming period and that this will be bearish for crypto assets.
Good luck to everyone.

VIX going higher: Sector Rotation UnderwayTVC:VIX is the tool I use for market timing. It tells us a lot. When it spikes to a Resistance (often 50% of the last major high) that tends to be a market bottom. But when you see what it is doing the last few weeks: Closing sustainably higher each bar... you know the market is pricing in more volatility.
VIX is known as the "fear index" and you can extrapolate that out to see that fear is increasing. The VIX is also the most forward looking indicator I have found for the stock market. All signs point to more broad market downside.
Another thing going on in context is a clear Sector Rotation. I noticed this last week but today's look at the Sector ETFs make it more clear. Not everything is down; AMEX:XLP and AMEX:XLU are up even as AMEX:SPY makes new lows. What this tells me is that investors are fleeing into "quality" stocks with low volatility and that pay dividends.
I'm currently sitting in cash, waiting for opportunities, and hedged some of my long term tax advantage accounts in AMEX:SH

Discipline is the keyThis channel is not providing individualized trading or investment advice, nor is it a banking service, brokerage service, trading service, investment service or money management service.

Vix is predicting a Black Swan EventI believe contrary to common thought; TVC:VIX is chartable with definitive patterns it follows. The pattern in question? Basic double bottom consolidation phases followed by breakouts bull flags retest of the bull flag bottom and follow through from there. We are currently breaking out of 2 double bottom patterns on the chart; one double bottom is the consolidation being used as the stand in for retest of the bull flag bottom with the bull flagpole being the sharp rally back in March 2020. The 2nd double bottom the chart is simultaneously breaking out of is the huge double bottom consolidation with the first bottom being from '91 to '08 while 2nd bottom is from '09 to now. Based on all of the above evidence I believe Vix is predicting a black swan event of biblical proportions for the market
