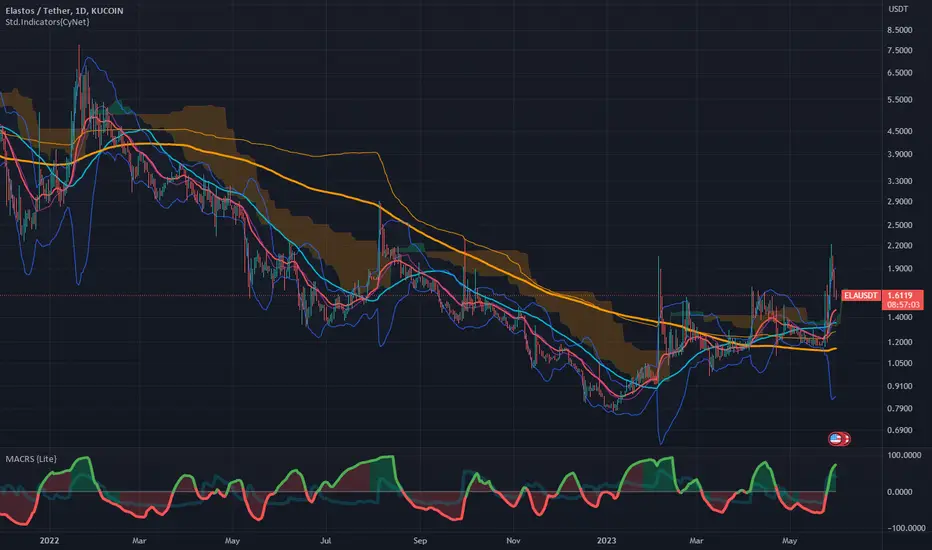
ELAUSDT bull markethi traders,
ELAUSDT has faced a deep correction after reaching 0,618 fib level.
It looks like the correction is finished and Elastos may be ready to go up again.
10$ is very easy target to achieve in the bull market.
It may go much higher but as this is not a new project, there are a lot of bag holders that may want to sell their coins so 10 $ looks like a reasonable level at least to take profit.
Patience is required but if you're patient, you will make it!
Good luck
ELAUSDT trade ideas

ELA Token: A Potential Hidden Gem for 2025The ELA token, a Layer-2 solution for Bitcoin, shows potential to emerge as one of the hidden gems of 2025, provided the project gains sufficient marketing traction. The team is actively working on utility improvements, but the token currently lacks widespread popularity. HTX:ELAUSDT
Key Technical Insights - Accumulation Phase
From a technical perspective, ELA has been in a prolonged accumulation phase, indicating a possible preparatory stage for future upward movement.
The monthly fair value gap is likely to act as a magnet for price, suggesting further upward potential.
Observations on the Money Power Indicator highlight zones where large players have accumulated positions, hinting at a foundational strength in the market structure.
On the Market Mood Indicator, the monthly chart shows we are currently in the zone of disbelief following a period of capitulation—a traditionally bullish signal.
There are two key liquidity pools above the current price levels that are likely to act as magnets for future price action.
With the right marketing push and continued development of its utility, ELA could position itself as a standout performer in the upcoming market cycle. Based on its market capitalization, reaching the $35 range seems highly achievable, aligning with historical patterns and technical indicators.
Hope you enjoyed the content I created! You can support this idea with your likes and comments so more people can see it.
✅ Disclaimer: Please be aware of the risks involved in trading. This idea was made for educational purposes only, not for financial investment purposes.
Check out my ideas about interesting altcoins in the related section below ↓
For more ideas, please hit "Like" and "Follow"!

Elastos 1000% Bullish Jump Confirmed!We looked at the biggest projects and we can see some red days, including today.
We can look at other projects, medium sized and small, and we can appreciate strong growth, green days.
This is what I've been talking about.
Those that grew strongly, can easily retrace and consolidate.
Those that are yet to grow, can start now to move ahead.
ELAUSDT (Elastos) is showing a strong, long-term higher low and is ready for growth.
We have full green today and this is only the beginning... Look at the chart.
Easy target 285%. Mid-term target 1,000% (more or less).
This is not all... We can expect strong growth all across the Altcoins market.
While the small pairs move ahead, the big ones will continue to consolidate.
After several months, everything grows.
The market is big now.
We are going up.
Are you ready?
We are going to start 2025 with a big bang. The confirmation is in the charts.
I will do an effort to show more examples just like this one.
They are hard to find so make sure to make the right choice.
Choose wisely, and the profits are all yours.
Namaste.

ELAUSD one of the best opportunity on the market but with a twisElastos as Layer 2 for Bitcoin have huge opportunity on the market and the best among Coinbase coins list.
Last december ELA has nice pump from the bottom of consolidation period and right now trying to find a support on it.
Currently you can see a bearish flag formed on ELA since march.
I expect it going one last time little bit lower to grab liquidity at +-1.2$
The main targets for the upcoming parabolic rise is 51$ and 100-125$
After retracement is finished at 1.2$ region then it should take approx. 2-3 months to go up to the final target.
Last shakeout before big gains

F meet kevin & all them Diddy boysThis could happen. I f with Chico crypto non meet kenin'z B a
Also no financial advice.
NEVER ANY FINANCIAL ADVICE HERE

$ELA AFTER 1,4$ UNSTOPPABLE The Quasimodo Reversal (QMR) pattern, observed in trading, consists of a sequence of price movements: starting with a high, followed by a low, then a higher high, and finally a lower low. This pattern signals a potential reversal in the market's direction, often indicating a shift from bullish to bearish or vice versa. Traders may use this pattern to anticipate price reversals and adjust their trading strategies accordingly. Elastos, like any other asset, may exhibit this pattern, providing traders with opportunities to capitalize on market movements.

$ELA downtrend continues AMEX:ELA is a project that i need to do a bit more digging on. However, it's looking it's downtrend will continue. There's not much to say about price action accept the fact that it could potentially create a lower low just based off he TSI and MACD. It looks as though it's loosing a bit of steam. The key points of retracement are outline within the chart, if it slides past those key points which i think it will, again it will create a lower low and continue down in it's descending channel. I just don't see any confluence for bullishness on it's weekly.
Good Luck!
#TeamBoomin 🚀

#ELAUSDT's Path to 115% Upside Potential💎#ELAUSDT is currently in the process of forming an extensive triangle pattern when examined on the 3D chart. This pattern exhibits the diligent respect for the uptrend trendline on the downside and the recognition of the supply zone around $2.07 on the upside.
💎A prominent development that has garnered our attention is the precise rebound from the 88.6% Fibonacci support level at $0.87. Remarkably, this bounce aligns almost perfectly with the Volume Profile level. Concurrently, when we consider the 50 Simple Moving Average (SMA), the price has consistently maintained trading above it, with the 50 SMA often acting as a reliable support.
💎At the present moment, #Elastos has once again descended close to the 50 SMA. Given the indication of a clean bounce from the Fibonacci support and the historical significance of the 50 SMA as a buying area, the probability tilts favorably towards an impending upward move.
💎The nearest resistance point is evidently the supply zone near $2.07. However, should this level be overcome by the buyers, the potential for a substantial price increase becomes apparent. The ultimate upside target rests near the 88.6% Fibonacci resistance level. Should this resistance level be reached, it would signify a remarkable 115% growth for #ELAUSDT.
💎Currently, the MCP team's focus is honed in on the price action surrounding the 50 SMA. As long as the price maintains its position above this level, the bulls are likely to maintain control. Subsequently, as the price begins to ascend, our attention will shift towards the supply area, which we anticipate may transform into a demand zone. At this juncture, the buying opportunity may manifest with heightened probability.
💎Amidst the positive aspects for #Elastos, it's essential to acknowledge the potential for an extended consolidation phase, where the price will undergo retesting of the uptrend trendline. Conversely, the worst-case scenario would materialize if the price breaches below the 88.6% Fibonacci support, thereby invalidating this bullish outlook.

ELA pierced above 200 daily SMA, retested and held above.Elastos (ELA), "China narrative", recent partnership new with Alibaba Cloud (from their twitter page), base layer is merged mined using BTC-hash coupled with "BPOS" in a "Hybrid Consensus" system, EVM-side chain with growing(?) ecosystem, founder Rong Chen was a senior engineer in Microsoft.
Been suppressed under the (thick orange) 200 daily SMA since Feb 2022, and now pierced above, retested, and bounced above it.
Green line is the 50 daily SMA. The area-cloud is the Ichimoku Cloud (my own settings) which had turned green (but relatively thin atm) and is where ELA presently is at.
Might start cautiously DCAing in a little now, but start adding significantly more at the red 21 EMA, green 50 SMA, thin-orange 200 VWMA, and thick-orange 200 SMA.
ELA to 1.35ELA flashing a bright green buy sign on the 1Day. Its also flashing a bullish divergence on Cipher B.
Its flashing a 9 on the demark 1Day. Its below a 9 on the 1Week and its flashing a 9 on the 2 week.
This is a swing trade idea. We could still see a lower entry.

Elastos web3 gem? accumulate in the rangeWe expect ELA price to retest the major support.
ELA may be hidden WEB3 gem therefore we believe that it may be a good to accumulate Elastos at the key support level if the price drops there and hold it for the next bull run.

Elastos is in good place ??Back from bottom of channel can make R/R of 3 and more but you have to buy in 2 or 3 step to manage the risks and set stop loss below the channel if it breaks
Have a good day
Learn and learn
NFA

Elastos ELA Price Targets and Stop LossELA/USDT
Entry Range: $2.69 - 2.89
Take Profit 1: $3.45
Take Profit 2: $4.05
Take Profit 3: $4.45
Stop Loss: $2.25

my thoughts to elausdt 5 may will be a important day for the coin 5th wave and and a new cycle to begin

$ELA same price action = same resultshello everyone i hope you good today , i just notice great price action and wanna share it with you.
In a completely similar movement 6 months ago, we note the following:
The two waves started mainly from the support line of the original ascending channel.
2- The price also rebounded from the same resistance area of the channel.
3- Reaching the same strong support area during approximately the same time period (26 days and 28 days).
4- There is a clear divergence in both cases with RSI und STOCHSTIC indicators.
-now if The same price movement leads to the same results,
The last time, the price rebounded violently within two days, until it reached 5.37,
Will the same scenario repeat?
what do you think?

ELAUSDT - long going for 2x above 4H 100EMAGoing for a 2x and a free moonbag above 4h 100EMA, with an invalidation below most recent low. R/R 30.

Long ELAUSDTLong ELAUST
Im looking to long ELAUSDT after a 6h close above 6.60
1st Target - 7.67 zone
2nd Target - 8.66 zone
invalidation daily close below weekly open of 6.19 after a breakout

$ELA THE BEASTSURPASSED the drop channel resistance line and is trying with the old classical resistance,
otherwise it will retest the channel line .
this beast have very good indicators levels and great volume.
we will see more from it

ELA/USDTHello friends, due to the price movement in the uptrend channel, if the resistance fails, we will see price growth.

ELA gogogo! few great men told me to keep it simple and it normally works 80% time, it will go past previous highs, maybe even sooner than this, so keep watching

ELAUSDT hidden gemElastos is a hidden gem.
It´s web3 token which is ready to continue its uptrend.
The demand line hasn´t been broken. Uptrend still in game.
0.618 fib level is our target , however if web 3 tokens have their hype, we expect Elastos to pump much higher
Strong buy now as it´s still cheap after recent correction
No financial advice


Is ELASTOS a potencial crypto 💤Here again, analyzing the market, I recently noticed the crypto ELASTOS , which I had on my watchlist when there was information on the COINBASE exchange and at the moment it has a lot of potential. But so far it has only gone down.
My first impression that I had was that price drop 95% since 2018. That caught my attention cause in that year cryptos like (Bitcoin, Etherum, etc..) did it to. Since then price started accumulating.
Trading analysis:
Price made a BOS (Break of Structure) and respected the zones of supply marked in blue. What"s next for another HH (Higher High)? Now price is dropping to the new supply zone 2.0$ close to our KL on 1.5$ .
1º Trend
If price start acummulating and getting closer to 2.0$ i will open my position to hold.
2º Trend
My second option will be to buy on 1$-1,5$ cause price break our HL (Higher Low) and expect price to range till the ending of March as you can see in the box (PAST) that can be reflected in the future.
