Volume Momentum Analysis my idea on the Daily and 4H Timeframes
On the daily timeframe (left), we observe a breakout above a previous high-volume candle. From a classical technical analysis or price action perspective, this could be seen as a false breakout. However, in volume analysis, this is interpreted as a liquidity grab, potentially signaling the beginning of a strong move.
On the 4-hour timeframe (right), the price has successfully broken above the high-volume candle and is currently in the process of retesting the breakout level, a key confirmation point before continuation.
when you thin outside the box, you will see the light BINANCE:ELFUSDT
Price Targets:
• First target: +30%
• Second target: +70%
ELFUSDT trade ideas

IDUSDT UPDATEIDUSDT is a cryptocurrency trading at $0.3183. Its target price is $0.5000, indicating a potential 50%+ gain. The pattern is a Bullish Falling Wedge, a reversal pattern signaling a trend change. This pattern suggests the downward trend may be ending. A breakout from the wedge could lead to a strong upward move. The Bullish Falling Wedge is a positive signal, indicating a potential price surge. Investors are optimistic about IDUSDT's future performance. The current price may be a buying opportunity. Reaching the target price would result in significant returns. IDUSDT is poised for a potential breakout and substantial gains.
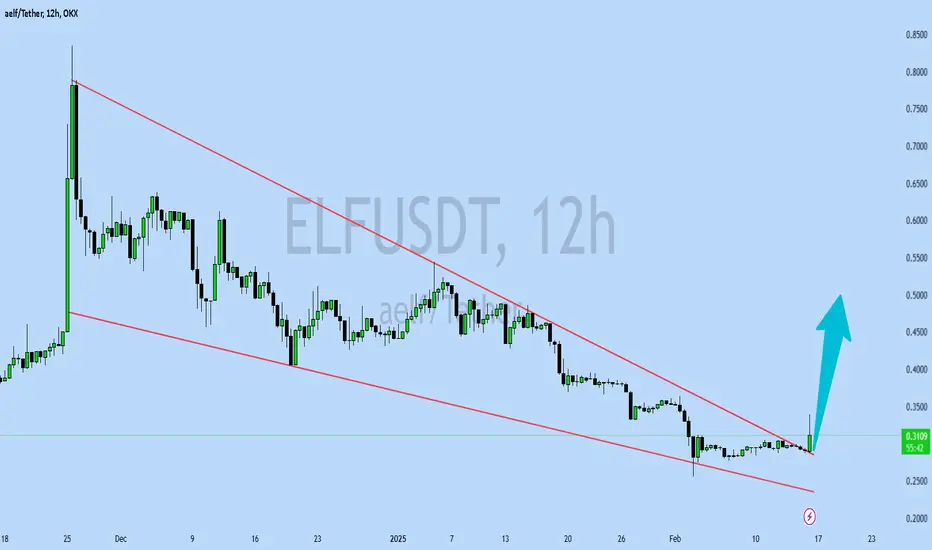
ELFUSDT UPDATEELFUSDT is a cryptocurrency trading at $0.3090. Its target price is $0.5000, indicating a potential 60%+ gain. The pattern is a Bullish Falling Wedge, a reversal pattern signaling a trend change. This pattern suggests the downward trend may be ending. A breakout from the wedge could lead to a strong upward move. The Bullish Falling Wedge is a positive signal, indicating a potential price surge. Investors are optimistic about ELFUSDT's future performance. The current price may be a buying opportunity. Reaching the target price would result in significant returns. ELFUSDT is poised for a potential breakout and substantial gains.

AELFaelf, an AI-enhanced Layer 1 blockchain network, leverages the robust C# programming language for efficiency and scalability across its sophisticated multi-layered architecture. Founded in 2017 with its global hub in Singapore, aelf is a pioneer in the industry, leading Asia in evolving blockchain with state-of-the-art AI integration and modular Layer 2 ZK Rollup technology, ensuring an efficient, low-cost, and highly secure platform that is both developer and end-user friendly. Aligned with its progressive vision, aelf is committed to fostering innovation within its ecosystem and advancing Web3 and AI technology adoption.
The story of aelf began on 10 December 2017, when aelf's vision and plans were introduced to global investors at a Coindesk conference. aelf successfully completed its fund-raising significantly ahead of schedule, having secured investments from notable institutions such as Arrington Capital, Draper Dragon, Galaxy Digital etc. aelf Testnet was successfully launched in 2018, followed by another successful launch of the Mainnet in 2020. aelf is currently operated and managed by a team of highly experienced Web3 veterans led by its founder and CEO, Auric, who bring a wealth of expertise, innovation and drive to the company.

Prepare to BUY Spot ELFUSDT on H4 CyclePrepare to BUY Spot ELFUSDT on H4 Cycle
🌟 Short-Term Opportunity with ELFUSDT! 🌟
🌍 Market Overview:
ELFUSDT is showing strong potential for gains on the H4 timeframe, making it an excellent short-term setup.
📊 Trade Plan:
📌 Entry Point: $0.48 - $0.52 – Accumulate within this range for optimal positioning.
🎯 Target: +30% – Aiming for quick and efficient profits.
⏳ Hold Time: 1-3 days – Aligned with the short-term cycle.
🔍 Strategy Insights:
H4 Momentum Strategy:
Ideal for capturing quick movements within a defined timeframe.
💡 Note: This is not financial advice. Always DYOR before trading.
🔥 ELFUSDT is primed for a strong move – Position yourself now! 🔥

ELF /USDT Analysis#ELF /USDT Analysis
NYSE:ELF The price is rebounding from the strong support zone at $0.4603 after a healthy correction, showing readiness for an upward movement. The technical pattern indicates a continuation of the bullish trend, with a target of $0.9674, representing a 100% potential gain. The mentioned support zone is crucial to avoid a trend reversal, while the current momentum suggests the likelihood of further upside.
Long Zone: $0.4603.
Target: $0.9674.

ELFUSDT | Massive Upside PotentialVolume Profile Insights: A significant volume surge is evident in the volume profile charts, indicating strong buyer activity.
Strategic Moves:
Early Entry: Securing a ticket on this bullish train early could be a game-changer.
Blue Box Zones: These are your key areas to watch for potential buy-in action.
Conclusion: The impressive buyer interest in ELFUSDT, coupled with the volume surge in the charts, suggests a potentially lucrative opportunity. Keep an eye on these strategic zones to make the most of this bullish momentum.
I keep my charts clean and simple because I believe clarity leads to better decisions.
My approach is built on years of experience and a solid track record. I don’t claim to know it all, but I’m confident in my ability to spot high-probability setups.
My Previous Analysis
🐶 DOGEUSDT.P: Next Move
🎨 RENDERUSDT.P: Opportunity of the Month
💎 ETHUSDT.P: Where to Retrace
🟢 BNBUSDT.P: Potential Surge
📊 BTC Dominance: Reaction Zone
🌊 WAVESUSDT.P: Demand Zone Potential
🟣 UNIUSDT.P: Long-Term Trade
🔵 XRPUSDT.P: Entry Zones
🔗 LINKUSDT.P: Follow The River
📈 BTCUSDT.P: Two Key Demand Zones
🟩 POLUSDT: Bullish Momentum
🌟 PENDLEUSDT: Where Opportunity Meets Precision
🔥 BTCUSDT.P: Liquidation of Highly Leveraged Longs
🌊 SOLUSDT.P: SOL's Dip - Your Opportunity
🐸 1000PEPEUSDT.P: Prime Bounce Zone Unlocked
🚀 ETHUSDT.P: Set to Explode - Don't Miss This Game Changer
🤖 IQUSDT: Smart Plan
⚡️ PONDUSDT: A Trade Not Taken Is Better Than a Losing One
💼 STMXUSDT: 2 Buying Areas

#ELF #USDT Long Set UpLooks like a short term reversal. I will long it on break of 0.5891
Entry 0.5891
Stoploss 0.5522
Tp-1 0.6277
Tp-2 0.6686

ELFUSDT (aelf) Updated till 25-11-24ELFUSDT (aelf) Daily timeframe range. we can see another smooth push from its local low. its trying to get a close over 0.7260, a confirmed close can run it to 0.9938 or above. of course if volume stays. recent support at 0.4960.

ELFUSDTWe can attempt to buy ELFUSDT from specified level if it break LH , also bullish divergence occur indicate that it moves upward.
SL , TP mention in chart.

ELFUSDT(aelf) Daily tf Range Updated till 03-08-24ELFUSDT(aelf) Daily timeframe range. another alt on Monitoring state at binance so gotta trade it carefully. its trapped between 0.3762-0.4634 for a while now. staying above 0.3762 will eventually give a chance to try again at 0.4634. need retail interest there.

aelf — Bollinger Bands Signal 18% Price PumpLatest Performance 📉
ELF has been in a continuous downtrend since March and has lost ~60% since then. However, during the latest market rebound, ELF showed some strength, too.
Signal Details 🧐
At the same time, the token flashed a bullish Bollinger Bands signal. The signal occurs once the price touches or falls below the lower Bollinger Band. At that time, the chance of the price recovering and moving back to (at least) the middle Bollinger Band is high.
Other Indicators ✏️
In hand with the Bollinger Bands, ELF finds itself highly oversold in terms of RSI and Stochastic Oscillator, too. This further seconds a possible recovery.
Potential 🔥
Based on the calculation, the signal has a profit potential of 18%. The profit potential matches almost perfectly with the long-term downtrend line at 0.46.

ELFUSDTELFUSDT is in strong bullish trend.
As the market is consistently printing new HHs and HLs.
currently the market is retracing a bit after last HH, which is 50% Fib retracement level and local support as well. if the market successfully sustain this bullish confluence the next leg high could go for new HH.
What you guys think of this idea?

ELFUSDT?
One of my theories/ thoughts.
>> Is looking at prices and it's heavy/ lots of seller areas.
It's like a fortress/ flood barrier.
When and once it's broken.
I need to be aware that in theory sellers been eaten up/ absorbed.
And buyers should be in control.
It's just a theory.
You shall explore and experience it.
IDK what gurus think. But to me it's a simple theory that I understand.
Then it shall prove to print higher prices.
IF if it's printing lower prices when you do a buy trade. It's obviously wrong.
For this as example.
60c hit . entry 1/4
Max I would pay is 0.7c for whole position.
then it shd print 0.80 bla bla
Target is 1.10
I wouldn't want it to print 0.55 /0.50 when resistance had been broken.
Market determine prices.. not you
I'm never a guru .Don't argue with me.. it's all theories.
Just sharing if anyone care to read ;)
my2c

ELF to 1$On the 1-day chart price action is trading near long-term resistance, in case of a breakout the target mentioned above becomes valid(potential top could be a little bit higher or lower, also there are bullish divergencies on the 4-hour chart on multiple indicators)


Elf 1W is bullish Elf on 1w chart is bullish since it has cup and handle and it retested the line as seen
Also it has shark pattern.
All the best insha Allah!

aelf ALF / USDT - BullishShow some strong signs:
1: Test 200 MA with good candle
2: Break 0.4393 level
3: breakout VWAP
If 0.4393 level + VWAP hold
Target
1. 0.51
2. 0.5461

ELF/USDT - aelf: BBand Breakout◳◱ On the $ELF/ CRYPTOCAP:USDT chart, the Bband Breakout pattern suggests an upcoming trend shift. Traders might observe resistance around 0.5558 | 0.6671 | 0.8366 and support near 0.3863 | 0.3281 | 0.1586. Entering trades at 0.4698 could be strategic, aiming for the next resistance level.
◰◲ General info :
▣ Name: aelf
▣ Rank: 143
▣ Exchanges: Binance, Kucoin, Huobipro, Gateio, Mexc, Hitbtc
▣ Category/Sector: Services - Shared Compute
▣ Overview: ælf looks to permit scalability and extensibility through a multi-layer branching structure formed by a main chain and multiple levels of side-chains.
◰◲ Technical Metrics :
▣ Mrkt Price: 0.4698 ₮
▣ 24HVol: 2,972,885.035 ₮
▣ 24H Chng: 9.408%
▣ 7-Days Chng: 0.04%
▣ 1-Month Chng: 27.52%
▣ 3-Months Chng: 56.16%
◲◰ Pivot Points - Levels :
◥ Resistance: 0.5558 | 0.6671 | 0.8366
◢ Support: 0.3863 | 0.3281 | 0.1586
◱◳ Indicators recommendation :
▣ Oscillators: NEUTRAL
▣ Moving Averages: STRONG_BUY
◰◲ Technical Indicators Summary : BUY
◲◰ Sharpe Ratios :
▣ Last 30D: 2.84
▣ Last 90D: 2.23
▣ Last 1-Y: 2.30
▣ Last 3-Y: 0.87
◲◰ Volatility :
▣ Last 30D: 1.04
▣ Last 90D: 0.80
▣ Last 1-Y: 0.60
▣ Last 3-Y: 1.12
◳◰ Market Sentiment Index :
▣ News sentiment score is N/A
▣ Twitter sentiment score is 0.58 - Bullish
▣ Reddit sentiment score is 0.61 - Bullish
▣ In-depth ELFUSDT technical analysis on Tradingview TA page
▣ What do you think of this analysis? Share your insights and let's discuss in the comments below. Your like, follow and support would be greatly appreciated!
◲ Disclaimer
Please note that the information and publications provided are for informational purposes only and should not be construed as financial, investment, trading, or any other type of advice or recommendation. We encourage you to conduct your own research and consult with a qualified professional before making any financial decisions. The use of the information provided is solely at your own risk.
▣ Welcome to the home of charting big: TradingView
Benefit from a ton of financial analysis features, instruments and data. Have a look around, and if you do choose to go with an upgraded plan, you'll get up to $30.
Discover it here - affiliate link -

ELFUSDT TODAY1-Apply your own risk management.
2-Daily and Weekly Targets
3-Hunt the profits at any level you see convenient for you.
10% Futures LEV 3

ELFUSDT1-Apply your own risk management.
2-Daily and Weekly Targets
3-Hunt the profits at any level you see convenient for you.
7% Futures LEV 3 tight SL 5%

ELFUSDT - BULLISH OUTLOOKELFUSDT is currently displaying a bullish trend on the 4-hour timeframe, characterized by a consistent pattern of higher highs and higher lows. This price action suggests a sustained upward momentum in the market. Additionally, the absence of any bearish divergence adds to the positive outlook, indicating that the bullish trend may persist.
Based on this analysis, a potential trading opportunity is identified:
Entry: Consider entering a long position at $0.46.
Stop Loss (SL): Set the stop loss at $0.43 to manage potential downside risk.
For take-profit (TP) levels, three options are available based on different risk-reward ratios:
TP 1:1: = $0.49.
TP 1:2: = $0.52.
TP 1:3: = $0.55.
This trade plan is designed to capitalize on the ongoing bullish trend while prudently managing risk through the placement of a stop loss. It's important to stay informed, monitor the trade closely, and be prepared to adjust your approach based on evolving market conditions

ELFUSDTELFUSDT was trading in symmetrical triangle pattern. The price was reacting well the support and resistance of triangle.
Currently the price has given the breakout of triangle and now retesting the broken level where it is also forming a local support zone and seems like the price may go for another leg higher.
If the breakout sustain to upside the optimum target could be 0.40
What you guys think of this idea?
