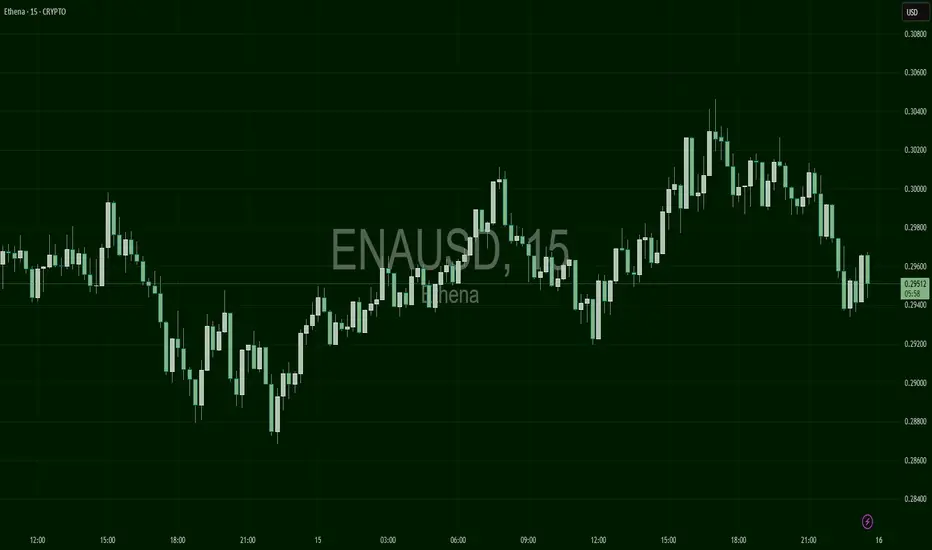
ENAUSD – Mid-Rally CorrectionENA had a consistent upward run overnight after forming a double-bottom near $0.285. The rally stalled at $0.306 with signs of profit-taking, now trending slightly lower.
ENAUSD trade ideas
$ENA: Bullish fundamentals and basing patternMIL:ENA has been under pressure since its earlier highs, tracing a similar pattern to BITSTAMP:ETHUSD logically, but recent developments and a potential bottoming pattern have caught my attention.
I’ve been actively trading MIL:ENA myself and have noticed a promising uptrend forming since the daily chart signaled a bottom, followed by the 3-day timeframe triggering a rapid surge when BINANCE:ETHBTC started trending up not long ago ( ).
Now, a larger weekly signal might be on the horizon, which matches BINANCE:ETHUSDT and BITMEX:BTUSDT chart developments. Once this signal fires, which could happen next week onwards, the probability of triggering a monthly signal with 600% to 4900% upside targets from here will be quite high.
Why MIL:ENA ?
A Quick Technical Overview of Ethena
Ethena is a synthetic dollar protocol on Ethereum, offering USDe and USDtb, crypto and treasury-bond backed stablecoin alternatives to fiat-based stablecoins like USDT or USDC.
USDe maintains its dollar peg through crypto assets paired with short futures to hedge volatility and earn the future funding rate (when positive) as revenue for the protocol, providing a decentralized, globally accessible savings tool called the "Internet Bond."
USDtb is backed by high quality short duration treasury assets including BlackRock's BUIDL fund exposure.
The MIL:ENA token enables governance and value capture. Staking it gives you partner project airdrop points as well as points for Ethena Season 4 airdrop that is coming out this year as the protocol expands.
Bullish Catalysts and News
*Airdrop farming for holders of MIL:ENA : Season 4 will run until September 24th 2025.You can earn multiple airdrops by holding staked MIL:ENA and locking it or using Pendle to do liquidity provision (keep YT mode on) or buying YT tokens if you want to take a leveraged airdrop farming (high risk/high reward). I mainly do LP with my holdings. Season 3 airdrop was quite good, I expect Season 4 to be even better as prices are likely to go much higher long term.
*On November 15, 2024, Ethena agreed to share a portion of its approximately $200 million in protocol revenues with tokenholders, which includes buying back its native ENA tokens. This initiative is part of a broader trend among DeFi protocols to enhance token value through revenue-sharing mechanisms like buybacks and fee switches. Ethena’s revenue, primarily from minting, redemption, and yield-generating mechanisms tied to its USDe stablecoin, supports this program, with the protocol recently achieving a daily revenue of $3.28 million. Additionally, Ethena plans to enable a fee switch to share revenue directly with ENA stakers once certain conditions are met, further aligning tokenholder incentives with protocol growth.
Best of luck!
Cheers,
Ivan Labrie.

ENAUSD: Strong bullish wave startingEthena is neutral on its 1D technical outlook (RSI = 52.271, MACD = 0.053, ADX = 32.166) as it's trading between the 1D MA200 and 1D MA50. The last time a rebound was supported by the 1D MA50, was in October 2024 and was the start of a Channel Up to the top of the Rectangle. Go long and TP = 1.3000.
## If you like our free content follow our profile to get more daily ideas. ##
## Comments and likes are greatly appreciated. ##

Ethena (ENA) Near Buy ZoneENA is approaching a key buy zone between $0.36–$0.33. If BTC holds the $102K support, the bottom may already be in, setting up a potential move toward a new higher high.
This setup offers a favorable risk-to-reward (R:R) ratio of 8.5, targeting the all-time high of $1.34, with a stop-loss below the previous low at $0.25.

ENAUSDTIt gave a lower bottom than I expected. If it is supported before reaching the breakeven level, it is a sign of strong support. Otherwise, I expect a price reaction when it reaches the breakeven level and the bottom of the descending channel.

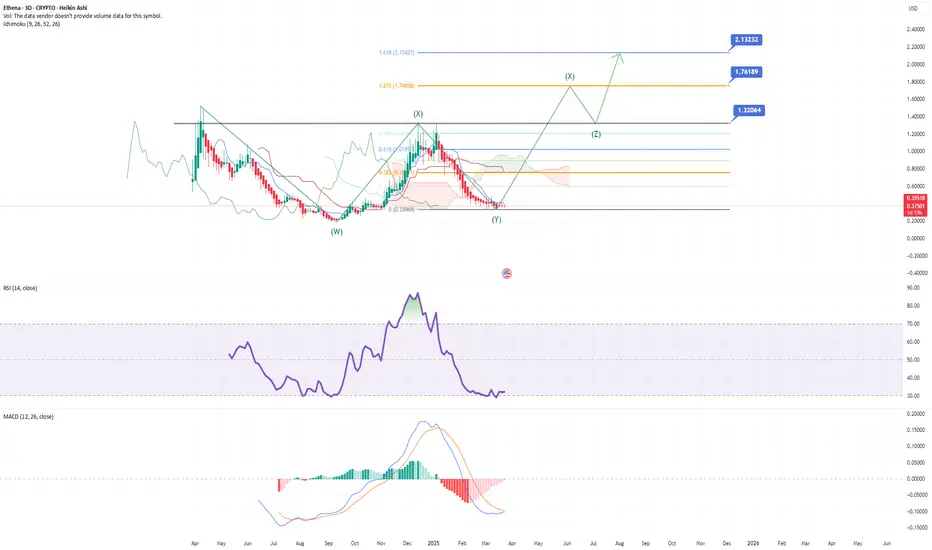
ENA/USD bottom fishing1. Major Support Levels
0.3300 - 0.3400: This is a very strong long-term support zone, marking the bottom of the previous bearish cycle (wave (Y)) and aligning with the 0% Fibonacci retracement.
0.3700 - 0.3800: This is the short-term support level where the price is currently consolidating near a thin Ichimoku cloud base.
2. Resistance Levels & Take-Profit Targets
Based on the WXY corrective structure and the projected Z wave, Fibonacci extension levels provide the following targets:
1.3206 (Fibo 0.786): This is your first take-profit level, coinciding with a previous swing high.
1.7618 (Fibo 1.272): The second target, a significant resistance according to Fibonacci extensions.
2.1232 (Fibo 1.618): This is the long-term target and a common level for major trend exhaustion.
3. Technical Indicators Supporting a Potential Wave Z Rally
RSI: Currently oversold at around 32, with a potential double bottom forming, suggesting a bullish reversal might be ahead.
MACD: While still below the signal line, the histogram is narrowing, showing selling pressure is fading.
Ichimoku Cloud: Price is still below the cloud but with a thinning and flattening cloud ahead, increasing the likelihood of a bullish breakout in the medium term.
4. Suggested Long-term Trading Strategy
Long Entry Zone: Accumulate between 0.33 - 0.38 for a long-term position.
TP1: 1.32 (about 3.5x from the bottom).
TP2: 1.76 (around 5x from the bottom).
TP3: 2.12 (6-7x potential return from the current support zone).
Stop-Loss: A weekly candle close below 0.33 would invalidate this long setup, and you should consider exiting.
5. Important Notes
This is a "bottom fishing" setup, so it might take 6 to 12 months for wave Z to fully develop.
Suitable for long-term investors who are comfortable holding for 6+ months.
Watch for confirmation signals like RSI breaking above 50 and MACD bullish cross.
Short bearish div on ENA m15 time frameshort setup for Ethena. bearish div breakdown on MIL:ENA m15 time frame.

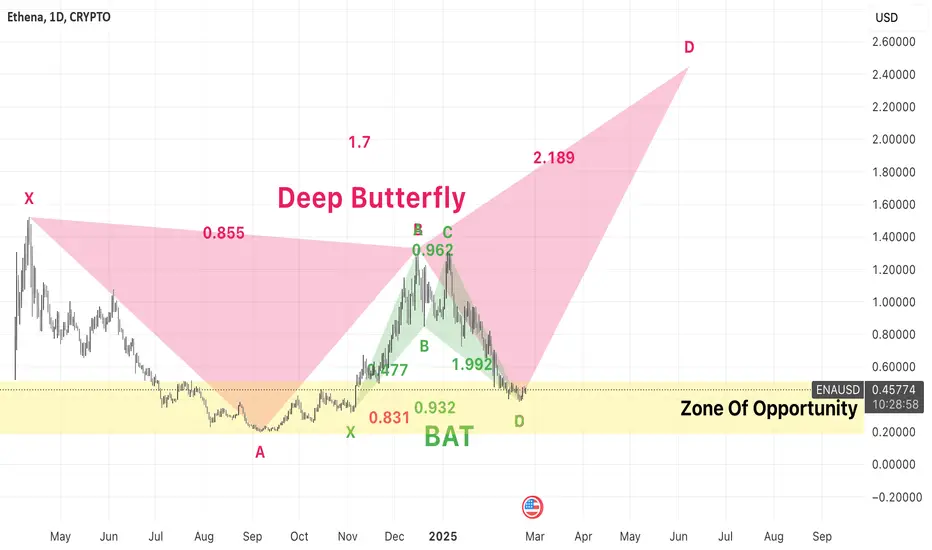
Perfect Time to Long $ENA – Targeting $0.80, $1.3, And $2.4This is a repost. The previous one was removed due to some rule violations by the TV mod.
Let the records show that the first post was made on Feb 21, 2025, 11:31 UTC, at the price of $0.43518.
CRYPTO:ENAUSD Ethena has formed a bullish bat harmonic on a smaller timeframe and a macro bearish deep butterfly on a longer timeframe. The bat has already completed, and Ethena has bounced off, starting an upward trend.
The deep butterfly, on the other hand, remains incomplete. It’s not guaranteed to play out, but if the market moves up—which seems inevitable sooner or later— CRYPTO:ENAUSD could revisit its previous all-time highs and potentially exceed them.
The $0.80–$0.89 range is a confluence of multiple indicators like Fibonacci levels, VRVP, and others.
$1.3 aligns with the 2025 high.
So, where does $2.40 come from?
First, the bearish deep butterfly pattern points to $2.40–$2.50 as a potential reversal zone. If it completes, that range could present a shorting opportunity for $CRYPTO:ENAUSD.
Second, fundamentals support a higher valuation. In less than a year USDEUSDT supply has jumped from 1.54B to 6.05B—nearly a 4x increase. Based on an analysis that my post got removed for, comparing CRYPTO:ENAUSD to CRYPTO:MKRUSD , even $2.50 would be an undervalued level.
Third, CRYPTO:ETHUSD has been in a prolonged downtrend, but sentiment has grown overwhelmingly bearish. Historically, when too many traders bet against something, the probability of a reversal increases. CRYPTO:ETHUSD / CRYPTO:BTCUSD has already begun trending up, repeating the same cycle behavior it has followed before. When Ethereum moves up alongside Bitcoin, it’s logical to expect Ethereum-based tokens to rally as well, regardless of fundamentals or technical patterns.
ENAUSD: Buy signal at the bottom of the Megaphone.Ethena just turned neutral on its 1D technical outlook (RSI = 47.814, MACD = -0.029, ADX = 25.505), which considering the +8% rise today, signifies the enormous upside potential of this coin. This is expected as the long term pattern is a Bullish Megaphone nonetheless. Each of the two HH formations on its top, where on the 4.0 Fibonacci extension. Buy and target the 4.0 Fib (TP = 2.4000).
## If you like our free content follow our profile to get more daily ideas. ##
## Comments and likes are greatly appreciated. ##

ETHENA - Identifying a trend shift using RSI, MACD, EMA and DivFirst post of 2025 to start the new year Journaling and using Basic tools Offered by Tradingview. The most Common Used by traders are RSI MACD and EMA's.
I am going use these indicators with descriptors of what I came to understand after reading the "About script" and applying them to my trade Ideas to see If I can correctly Identify Strength and Weakness in markets.
I have plotted out on the charts what the use cases are for these tools.
RSI, MACD and EMA's are momentum Indicators, They are not used to identify where a reversal will happen but over a period of time where you can see trend start to shift or continue trending based on the Information they provide.

EthenaEthena is this cycles LUNA (before it blew up). TVL and overalls upport for the protocol increasing steadily. Cup and handle breakout, don't fade the trend.

CRYPTO : Simple Breaking out Strategy using PivotsHere I have a screening with simple criteria on a 4H basis. Today there were many coins on the upside. I took 5 of them and for each allot 3,233,499 USD with a 1:100 margin therefore
32,335 USD required margin for each.
That gives the following position :
2678956 BITFINEX:ENAUSD
2976617 COINBASE:ADAUSD
169951 CRYPTO:DEXEUSD
2147506 CRYPTO:FARTCOINUSD
7290374 CRYPTO:XLMUSD
at an average price of 1.059325717 for a margin total of 161,689 USD
My target is 1.09204829 or +3.089%
This should generate 500kUSD


Ethena _ Downtrend Breakout _ 0.6 Fib is 1st Target +62% PROFITFalling Channel Pattern is Breakout and Uptrend Continuation. 1st Target is the 0.618 Fibonacci level price at 0.70091110 USD. Offering the chance to Achieve +62% Percentage Profit. And 2nd Target is the Downtrend line Top. Offering the potential to Achieve a +149% Percentage PROFIT.
Support me; I want to Help People Make PROFIT all over the "World".

#ENA/USDT has formed a falling wedge pattern🧐 A successful bre#ENA/USDT has formed a falling wedge pattern🧐
A successful breakout could lead to a bullish wave of 50%✈️


ETHENA looks ready to head up. Bullish.
Ethena has been in a downtrend for some time recently, but technicals are looking up right now. If we can maintain this momentum, and have this IHS play out, we could rip higher to the first profit target shown, then maybe way higher. We will see. Volatility is also very constricted and tight on this cryptocurrency right now.
And as everyone here knows... Low Volatility proceeds by Volatility.
Not Financial Advice. Do all of your own research. For me these are long term holds. Not "Trades". Risk Management still applies. Happy Hunting ; )

ENAUSDTENAUSDT is in strong bearish trend.
As the market is consistently printing new LLs and LHs.
currently the market is retracing a bit after last LL, which is 50% Fib retracement level and local support as well. if the market successfully sustain this selling confluence the next leg lower could go for new LL.
What you guys think of this idea?

$ENA resistance to breakWe almost filled the upside gap
Currently, we can see that 1.36 is acting as the local resistance here
Failure to get above this level, then we may retest ltf demand around 1.16 to 1.12
Invalidation: price gets above 1.36
Local support: 1.24
