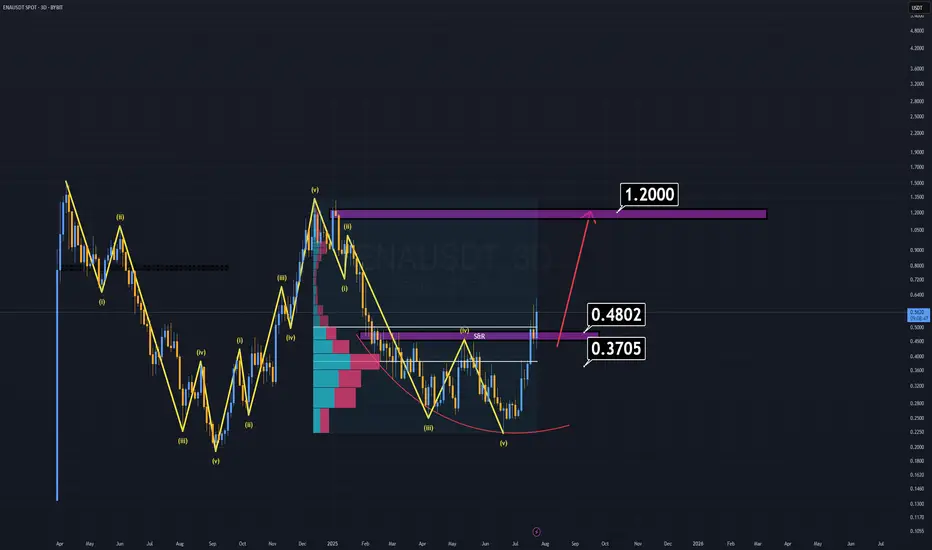
Ethena Bullish Momentum Builds, Eyes 30% Rally to $0.85Hello✌
Let’s analyze Ethena’s upcoming price potential 📈.
BINANCE:ENAUSDT has demonstrated strong bullish momentum recently, supported by positive fundamental developments 📈. The price is currently near key daily and Fibonacci support levels. If these hold, a potential 30% upside targeting $0.
Related pairs

Ethena · Millions Overnight? It Can Be DoneEthena is starting its 2025 bullish cycle with three full green candles. The current week has the highest volume since the first week of trading in April 2024. Normally the first week of trading tends to produce the highest volume. ENAUSDT is matching those days now and market conditions are so much

ENA short to $0.4910Just now opened a short on ENA. Aiming for $0.4910
Seems likely to dump further based on DTT analysis- Learn more on X.
Sl: $0.5435
Roughly 2 RR from my entry

ENA / USDT#ENA / USDT
Iam expecting big returns from ETH and its related coins in this season
This chart is also looking good
Another Potential round bottom pattern under formation
Keep an eye

ENA is the cleanest chart I've ever seenThis is the first token among all my reviews that is in harmony with all indicators of purchases, liquidity, and everything else. But first things first:
➡️ First, purchase volumes are in harmony with the price. As the price rises, so do purchase volumes, signaling growing interest in the token.
➡

Ena short to $0.5180Just now opened up a short position on ENA. Ena seems like a pair that wants to pump but at the moment I just think its relatively too high and likely will dump down further before correction.
Based on my DTT analysis- Direction, Target and timing it'll probably dump back to $0.5180
That's the di

ENA Analysis (3D)ENA has been outperforming many altcoins for weeks, yet it still appears undervalued based on its fundamentals and recent investor interest.
Where to buy?
Right now, buying at current levels is extremely risky, as the ideal buy-back zones are significantly below the market price.
First major suppo
Ena short to $0.5962Just opened a short on Ena. Aiming for $0.5962
Sl: $0.6405
Should be able to get at least 2RR still.
Time sensitive

ENAthe daily closed inside THE CLS RANGE
This means that the price will likely revert, into the OB as shown in the chart (which is my entry)
Im confident in targeting the full range as the liquidity is stored there + ENA tapped the daily OB today which is generally bullish.
And
As we all know, mark

#ENA worth keeping an eye worth to keep an eye here on ENA, currently at weekly/monthly resistance zone, if breaks further then different story However if we do get that retrace will be worth to trade for good R:r setups

See all ideas
Summarizing what the indicators are suggesting.
Oscillators
Neutral
SellBuy
Strong sellStrong buy
Strong sellSellNeutralBuyStrong buy
Oscillators
Neutral
SellBuy
Strong sellStrong buy
Strong sellSellNeutralBuyStrong buy
Summary
Neutral
SellBuy
Strong sellStrong buy
Strong sellSellNeutralBuyStrong buy
Summary
Neutral
SellBuy
Strong sellStrong buy
Strong sellSellNeutralBuyStrong buy
Summary
Neutral
SellBuy
Strong sellStrong buy
Strong sellSellNeutralBuyStrong buy
Moving Averages
Neutral
SellBuy
Strong sellStrong buy
Strong sellSellNeutralBuyStrong buy
Moving Averages
Neutral
SellBuy
Strong sellStrong buy
Strong sellSellNeutralBuyStrong buy
Displays a symbol's price movements over previous years to identify recurring trends.
Frequently Asked Questions
The current price of ENA/TETHERUS (ENA) is 0.5521 USDT — it has fallen −1.54% in the past 24 hours. Try placing this info into the context by checking out what coins are also gaining and losing at the moment and seeing ENA price chart.
ENA/TETHERUS price has fallen by −5.82% over the last week, its month performance shows a 96.00% increase, and as for the last year, ENA/TETHERUS has increased by 50.44%. See more dynamics on ENA price chart.
Keep track of coins' changes with our Crypto Coins Heatmap.
Keep track of coins' changes with our Crypto Coins Heatmap.
ENA/TETHERUS (ENA) reached its highest price on Dec 16, 2024 — it amounted to 1.3300 USDT. Find more insights on the ENA price chart.
See the list of crypto gainers and choose what best fits your strategy.
See the list of crypto gainers and choose what best fits your strategy.
ENA/TETHERUS (ENA) reached the lowest price of 0.1940 USDT on Sep 7, 2024. View more ENA/TETHERUS dynamics on the price chart.
See the list of crypto losers to find unexpected opportunities.
See the list of crypto losers to find unexpected opportunities.
The safest choice when buying ENA is to go to a well-known crypto exchange. Some of the popular names are Binance, Coinbase, Kraken. But you'll have to find a reliable broker and create an account first. You can trade ENA right from TradingView charts — just choose a broker and connect to your account.
Crypto markets are famous for their volatility, so one should study all the available stats before adding crypto assets to their portfolio. Very often it's technical analysis that comes in handy. We prepared technical ratings for ENA/TETHERUS (ENA): today its technical analysis shows the strong buy signal, and according to the 1 week rating ENA shows the buy signal. And you'd better dig deeper and study 1 month rating too — it's buy. Find inspiration in ENA/TETHERUS trading ideas and keep track of what's moving crypto markets with our crypto news feed.
ENA/TETHERUS (ENA) is just as reliable as any other crypto asset — this corner of the world market is highly volatile. Today, for instance, ENA/TETHERUS is estimated as 10.49% volatile. The only thing it means is that you must prepare and examine all available information before making a decision. And if you're not sure about ENA/TETHERUS, you can find more inspiration in our curated watchlists.
You can discuss ENA/TETHERUS (ENA) with other users in our public chats, Minds or in the comments to Ideas.