Ena short to $0.5180Just now opened up a short position on ENA. Ena seems like a pair that wants to pump but at the moment I just think its relatively too high and likely will dump down further before correction.
Based on my DTT analysis- Direction, Target and timing it'll probably dump back to $0.5180
That's the direction and target and in terms of timing it'll probably start to do so anytime now given my analysis is correct.
Sl: 0.6127
Tps on chart
Time sensitive
ENAUSDT trade ideas

#ENA worth keeping an eye worth to keep an eye here on ENA, currently at weekly/monthly resistance zone, if breaks further then different story However if we do get that retrace will be worth to trade for good R:r setups

ENA 8H +164% From Trend Entry, But Can Support Hold?The MACD Liquidity Tracker Strategy caught a clean +164.38% move on ENA after price reclaimed both the 60 and 220 EMAs with MACD momentum flipping bullish.
The entry came just as consolidation ended and trend expansion began — no early exits, no chop. Price is now testing the 60 EMA again, which has acted as dynamic support throughout the run.
If bulls defend this zone, continuation remains on the table. But if it cracks, a deeper pullback could be in play.
📊 Strategy Settings:
MACD: 25 / 60 / 220
EMA Filter: 60 & 220
Mode: Normal
Timeframe: 8H
Educational analysis. Let’s see how this plays out.

ENA is the cleanest chart I've ever seenThis is the first token among all my reviews that is in harmony with all indicators of purchases, liquidity, and everything else. But first things first:
➡️ First, purchase volumes are in harmony with the price. As the price rises, so do purchase volumes, signaling growing interest in the token.
➡️ Second, the Money Flow indicator also shows harmony with the price, signaling inflows of new liquidity into ENA. This indicates a growing number of traders and holders.
➡️ However, the price of ENA, as a less liquid token, has been growing rapidly and strongly recently. During its growth, it formed two gaps at the levels of $0.564 - $0.480 and partially closed at $0.461 - $0.400. As we know, in 99% of cases, gaps close sooner or later.
➡️ But just look at this support level starting at $0.494. There is a whole queue lined up to buy the token at the slightest correction. So there is certainly no need to worry about buybacks during the correction.
📌 Conclusion:
I will definitely be taking a position in ENA. But first, I will wait for the gap to close, because the price has probably not yet reached its peak and will be even higher in the coming months. But it is too risky to buy at the local peak.
As soon as the price closes the first GAP and reaches support at $0.484, it will become extremely attractive to buy, and it will potentially form a higher low there if it maintains its bullish momentum.
🔥 Subscribe to see more trading ideas for the hottest tokens on the market!

ENAUSDTlet see what will happen my expactation it is. it is doing w and high. there is idm level and below of it exist fvg and order block when you check daily and weekly you will see the level which i mention

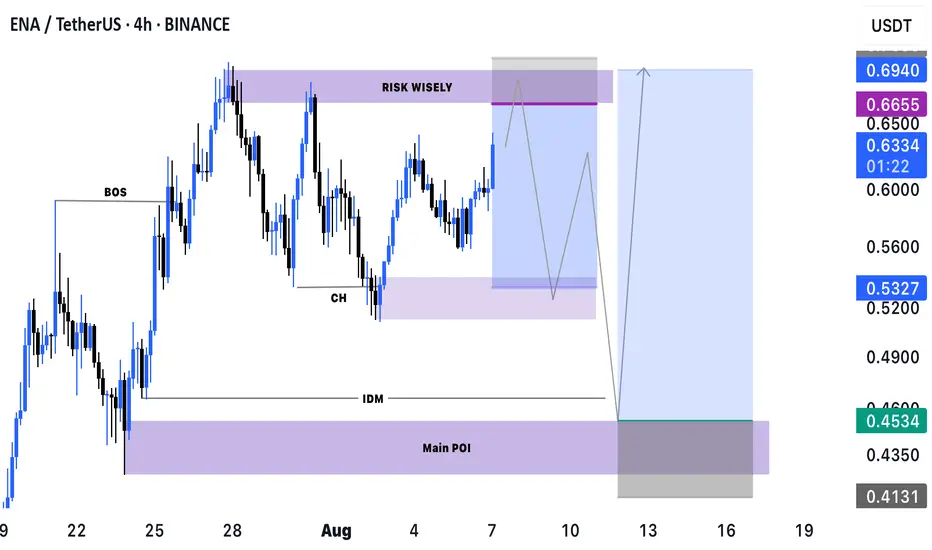
$ENA SELL/BUY TRADE SETUP
MIL:ENA has been gaining solid traction over the past few weeks, and the chart is shaping up nicely. Here are two trade scenarios I’m currently tracking:
🔻 THE SELL SETUP
This sell trade carries moderate risk, as the sell-side order block has already been mitigated. However, it still holds potential for a short-term decline.
• Entry: $0.6655
• Target: $0.5327
• Stop Loss: $0.7035
If we hit the sell target, price may bounce briefly—giving us another opportunity to buy before a possible continuation to our deeper buy point.
🟢 THE MAIN BUY SETUP (POI)
This is my preferred scenario. We’ve had a Break of Structure (BOS) on the left side, making the BOS Origin combined with Inducement (IDM) a strong confluence for the next bounce.
• Entry: $0.4534
• Target: $0.6940
• Stop Loss: $0.4131
Let’s see how this plays out—good luck to us!
#ENA #Ethena #CryptoTrading #Altcoins #TradeSetup #SMCtrading
ENAUSDT - Bullish Flag or Descending Channel?My operation is to eat the profits of this period, and then change the operation according to the market

day 2 trend tradeyesterday was day 1 so today is day 2. stop hunt in newyork and giving a confirmation at 9:30

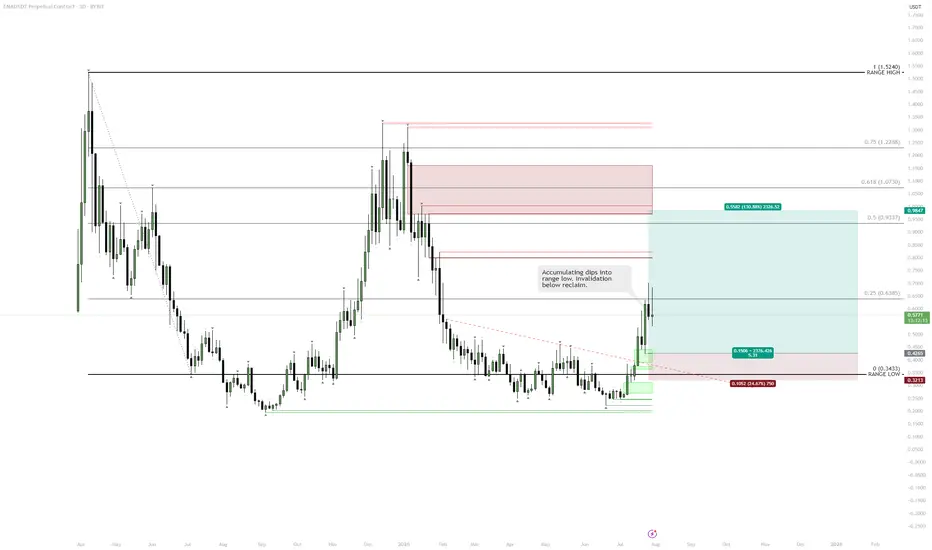
ENA | Range Low Reclaim — Targeting Midrange and AboveClear reclaim of the range low and a strong daily close confirm a bullish market structure shift.
Printing a higher high signals potential for continuation.
Dips toward the reclaimed range low are healthy, providing buy-the-dip opportunities.
Accumulation at the range low with invalidation below keeps risk tight.
Plan:
Accumulate pullbacks toward the range low.
Hold for midrange ($0.83) and upper range/major resistance.
Bullish Bat (1.272 Target)Bullish Bat Harmonic Pattern Discovered on the Larger Timeframes for ENA-USDT. 1.272 Fibonacci Target. 3:1 Trade Setup

EnaEna is retracing back with not so many obstacles on the way, similar to previous price action Ena is set to head to our next destinations

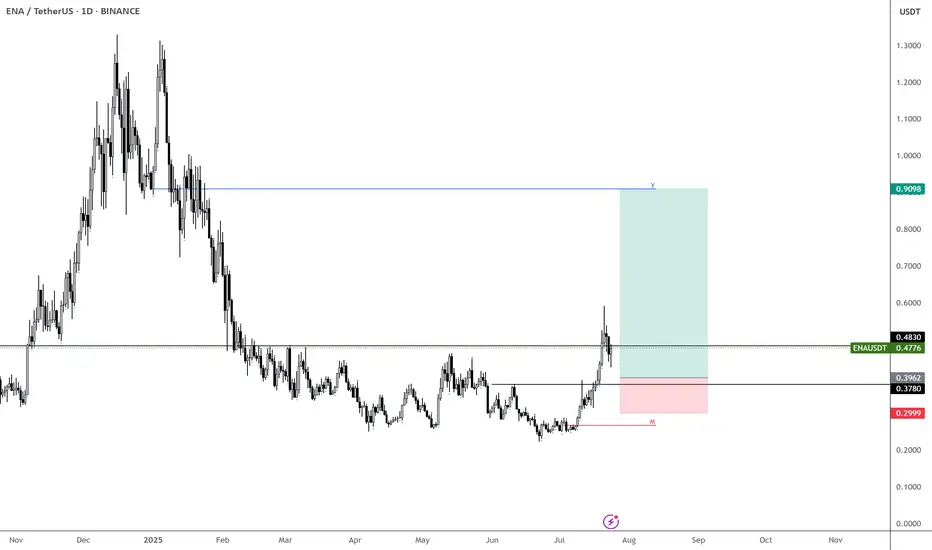
Long-Term Technical Analysis of ENA CoinENA coin continues its downward movement after being rejected from the $0.70 resistance level. As long as ENA holds above the 4H support level at $0.5549 with confirmed 4-hour candle closes, it is likely to attempt a rebound toward the weekly resistance zone (marked in blue).
However, if ENA loses the $0.5549 support level and closes multiple 4H candles below it, further downside momentum is expected. In such a scenario, the initial downside target would be $0.4611.
For long-term spot investments in ENA, the price range between $0.3952 and $0.3781 should be closely monitored by investors.
Our plan is to accumulate ENA coin within the $0.3952 – $0.3781 support range for long-term spot positions. If the price reaches this zone, our target will be set at $1.
Not Financial Advice (NFA).

Ena short to $0.5962Just opened a short on Ena. Aiming for $0.5962
Sl: $0.6405
Should be able to get at least 2RR still.
Time sensitive

ENA Explodes After Breakout – What’s Next?
ENA Exploded 100%+ After Our Post 🚀
Just days ago, we highlighted ENA as one to watch — and it delivered.
Since then, price has nearly doubled, breaking past key resistance with strong volume and momentum.
This is why timing + conviction matters. When the setup is clean, the move speaks for itself.
Ethena · Millions Overnight? It Can Be DoneEthena is starting its 2025 bullish cycle with three full green candles. The current week has the highest volume since the first week of trading in April 2024. Normally the first week of trading tends to produce the highest volume. ENAUSDT is matching those days now and market conditions are so much better in 2025 compared to 2024.
The entire bullish period last year lasted less than two months. That's it. This wasn't an uptrend nor a bull market, it was more like a bullish jump. A momentary event. ENAUSDT right now is entering the 2025/26 bull market. Growth can be sustained for a period of 6 months or longer. Sometimes a bull market trend can last 8 months, 12 months, or even 16 months or longer. We have many examples across the market.
This week Ethena is trading above EMA55 weekly for the first time ever. The bullish bias is confirmed.
When I saw this pair it was already moving, not the bottom catch that I like and go for and yet, I still went ahead on it because it is still early when you consider the bigger picture; practice what you preach.
We missed the bottom but it is still early, there is plenty of room available for growth. Trading is easy when the market is approached with the right mentality, with a simple working plan. Buy and hold. Watch how the market will take care of the rest.
Just deposit and continue to invest, as much as you can. Continue to add to each position you like and grow; let it grow. Check back every 3 weeks, every 1-2 months; watch your money grow. It is truly that simple. Timing is very important for this strategy and the best timing is now. Right now we are on the verge of a major advance, no need to wait. You can buy today and start earning within days.
A few months back, we had to wait for months. A few weeks back, we had to wait for weeks. Entering the market now, the wait is short but patience is key.
It will go higher than what is shown on the chart. This publication is to alert you of a great timing, be ready to wait. Make sure to do your own planning. The risk is minimum when trading spot. The worst case scenario is a long wait. If things go right; enter green, stay green and profits-capital grow.
Success can be achieved but the hard part is being around now, when prices are low. It is easy to be around when there is hype and everything is 1,000% up. But can you beat the impulse to sell when the right choice is to buy? Can you take action now and go ahead?
If you are reading this now, you are in the right track but for many people it is not that easy, they are allergic to low prices and they won't be reading this until it is too late. 90% of the people will only become aware of these opportunities that I am showing you daily when it is too late.
That's ok. We use the experience to learn. When I first started I went through the same process. The euphoria got my attention and when I became aware of the market everything was already high up. We tend to join at the market top. But then we go through the entire cycle, the market is here to stay. We get to buy the bottom, we gain experience and in the end we can always win if we never give up. Persistence and consistency, be ready to hold.
If you can hold your altcoins when prices are low, you will reap the rewards at the time of the bull run. Millions to be made overnight. Years of preparation, but it can be done.
Namaste.

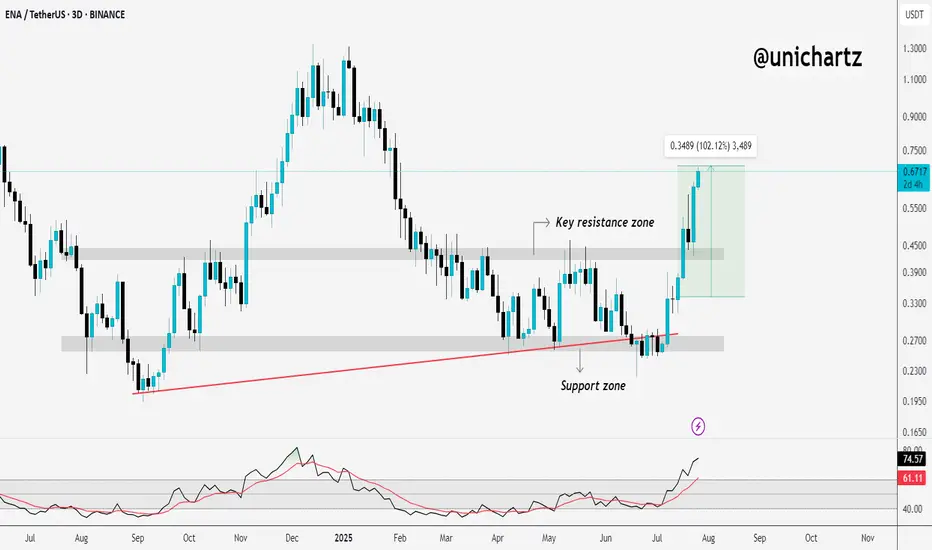
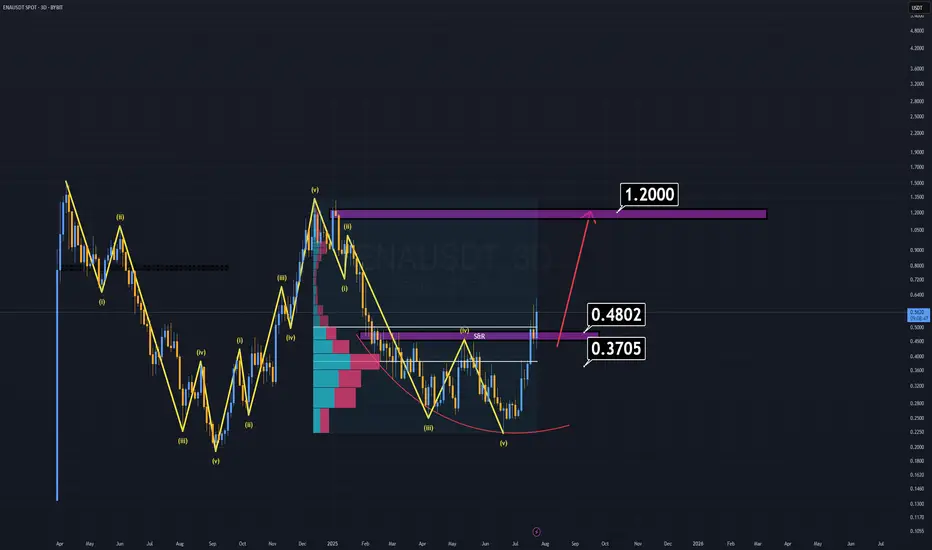
ENA Analysis (3D)ENA has been outperforming many altcoins for weeks, yet it still appears undervalued based on its fundamentals and recent investor interest.
Where to buy?
Right now, buying at current levels is extremely risky, as the ideal buy-back zones are significantly below the market price.
First major support: $0.48 — considered a "cheap" entry.
Dream entry (low probability): $0.37–$0.38 — at that point, ENA would feel almost free.
Notably, BlackRock and its partners are actively investing in ENA, which speaks volumes about its long-term credibility. That alone justifies keeping it on your radar.
Minimum target: $1.00–$1.20
Remember, that’s just the beginning. We may see even more once momentum kicks in.
Sometimes, the best trade is the one you're waiting for.
Good luck.
ENA Coin Forms a W Pattern: Reversal Potential GrowsOn the global chart of the ENA coin, a W pattern is forming, indicating a possible reversal and growth. It is worth noting that since the launch, the coin has not yet realized its full potential.
Current price: $0.56
If the pattern is realized, a movement to the $0.58 zone is expected and in the case of an increase in momentum to $0.73
Also, according to the structure of the pattern, a correction to the $0.43 region is possible before continuing the upward movement
This analysis is based on the technical pattern and also incorporates AI to provide more accurate results.
outside day setup50% pullback to the 200ma on the daily chart. looking for it to go to new high. after an outside day it crossed above the 200ma and 20ma on the 15min.made a acending triangle supported by the 20ma, breakout in the gaptime and now pulls back and giving an entry at the open of london. looking to hold till close. breakeven if it hit the breakeven target
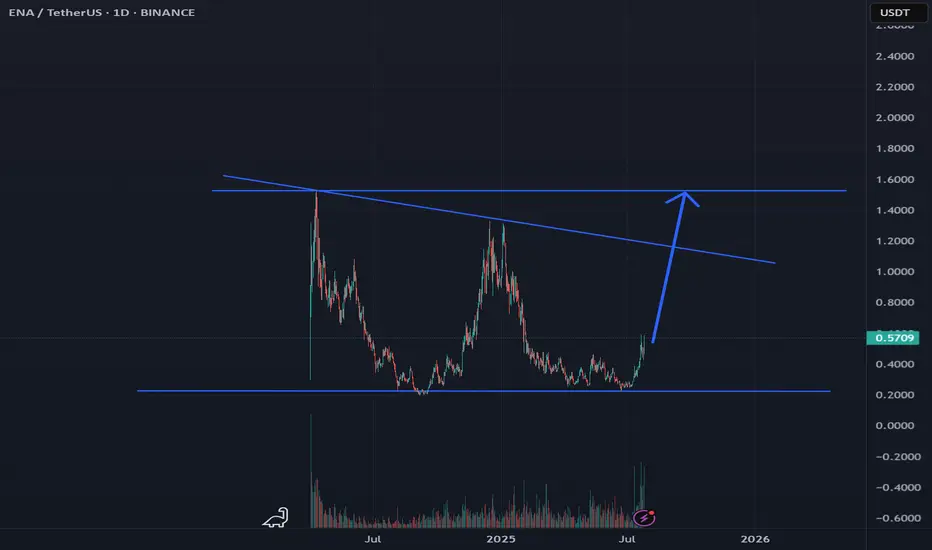
ENA – Sub-40c Would Be a Gift
If we get BINANCE:ENAUSDT below 40c, that would be an incredible opportunity.
Maybe I’m being too greedy—or maybe not. I’ll let the market decide.
Right now, ENA looks like a solid play for the coming weeks, so I’m focused on finding the best possible entry.
MARKETSCOM:ETHEREUM still looks strong overall. Even with a minor retrace, I’m expecting higher—potentially up to $7k.
So it makes sense to position in names like BINANCE:ENAUSDT , BINANCE:EIGENUSDT , BINANCE:AAVEUSDT , and others to ride the wave.
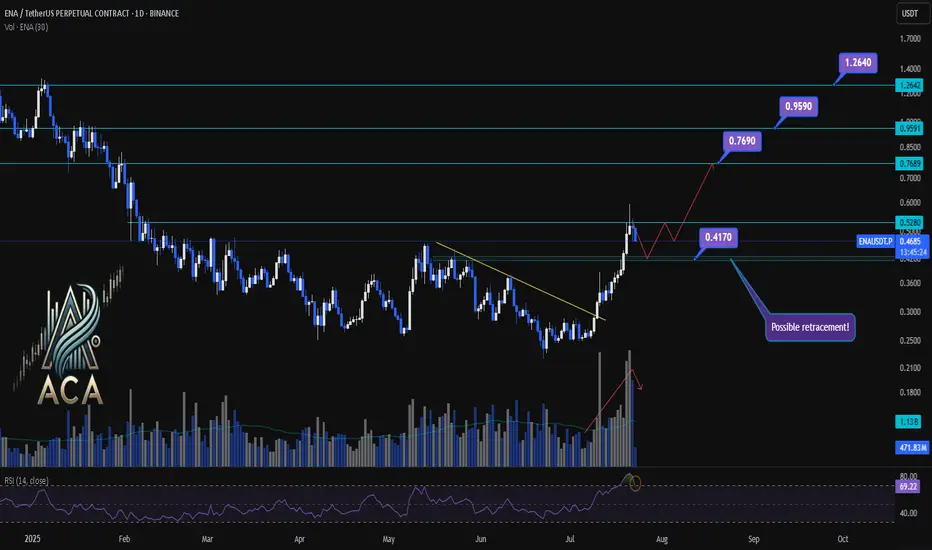
ENA/USDT Chart Analysis | Volatility Signals & Bullish TriggersENA/USDT Chart Analysis | Volatility Signals & Bullish Triggers
🔍 Let’s dive into the ENA/USDT perpetual contract and analyze recent price action, focusing on momentum shifts and key breakout scenarios.
⏳ Daily Overview
The daily chart shows that ENA recently reentered the overbought zone on the RSI, which can serve as a potential trigger for traders watching momentum shifts. Earlier, price action broke decisively above a long-standing descending trendline, resulting in a rapid, nearly 100% surge, a classic RR2 move off the trendline. This breakout coincided with a visible uptick in trading volume, confirming strong demand behind the move.
Now, during the ensuing rest or correction phase, trading volume is decreasing—often a constructive sign suggesting either profit-taking or a healthy pullback rather than panic selling.
🔺 Bullish Trigger & Setup:
- RSI Signal: Reentry into the RSI overbought zone is a potential long trigger, especially if confirmed by price action.
- Confirmation Level: A daily close with strong volume above $0.528 would add conviction to a bullish setup.
- Trendline Reference: The break above the recent trendline fueled the rapid advance, showing the importance of watching such key resistance levels.
📊 Key Targets (on further bullish confirmation):
- $0.769 — First upside resistance.
- $0.959 — Next bullish target.
- $1.264 — Extension target if momentum continues and broader market sentiment remains supportive.
🚨 Conclusion:
Eyes are on the $0.528 level—closing above it with volume, especially while RSI holds in the overbought zone, could provide the next strong entry signal. Current declining volume during pullbacks suggests this is likely a profit-taking phase or standard correction, not bearish capitulation. Keep monitoring RSI, volume profile, and price closes for the next actionable opportunity.
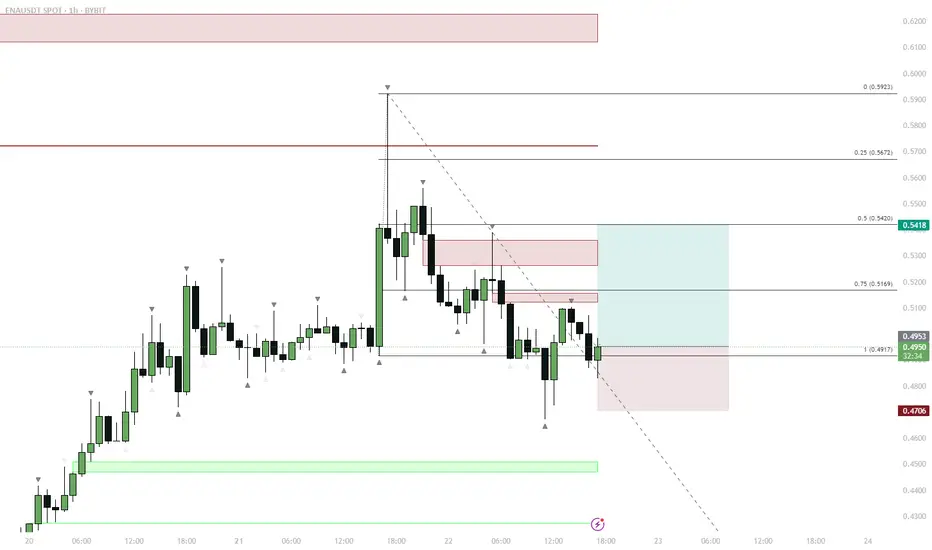
ENA — Range Deviation & Reclaim: LTF Long Setup
ENA traded in a tight LTF range, then deviated below support, forming a sweep/liquidity grab.
Price quickly reclaimed the range low and retested the FVG (Fair Value Gap) below the range.
This reclaim/flip is a classic bullish reversal setup after a sweep.
Entry on the retest of FVG and previous support, targeting a move back to mid-range and then range highs.
Invalidation below the deviation low (stop).
Price action shows a textbook range deviation and reclaim setup. ENA swept liquidity below the range, trapped shorts, and reclaimed support, forming a bullish reversal signal. The retest of the FVG provided a high-probability entry for a move back to the range highs. This play relies on the principle that deviation and reclaim below a range often leads to a reversal as trapped sellers are forced to cover.
ENA Swing planENA swing plan explained in the chart.
Strategy: Supply and Demand.
Higher Time frame confirmations needed before entering.
Scaled entries would be preffered.

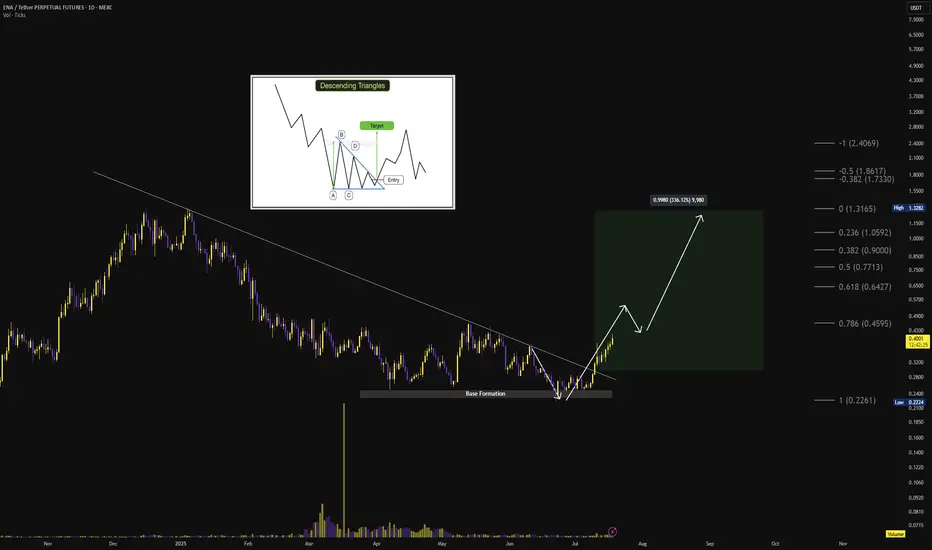
$ENA HTF Descending Triangle ReversalDescending triangle + 10-month base accumulation, breakout initiated above long-term diagonal resistance 🔻📈
Breakout Confirmation: ✅ Breakout confirmed above $0.30
🎯 Targets:
🟢 Short-term: $0.45
🟢 Mid-term: $0.64, $0.77, $0.90
🟢 Long-term: $1.05, $1.31, $1.73+
Momentum: Volume expansion validates breakout; price action suggests impulse wave forming with sustained higher lows
❌ Invalidation: Breakdown below $0.22 (Fib 1.0 level and base structure) 🔴