ENA/USDT Breakout Pattern (18.04.2025)The ENA/USDT pair on the M30 timeframe presents a Potential Buying Opportunity due to a recent Formation of a Breakout Pattern. This suggests a shift in momentum towards the upside and a higher likelihood of further advances in the coming hours.
Possible Long Trade:
Entry: Consider Entering A Long Position around Trendline Of The Pattern.
Target Levels:
1st Resistance – 0.3015
2nd Resistance – 0.3217
🎁 Please hit the like button and
🎁 Leave a comment to support for My Post !
Your likes and comments are incredibly motivating and will encourage me to share more analysis with you.
Best Regards, KABHI_TA_TRADING
Thank you.
ENAUSDT trade ideas

ENAUSDT 1DENA ~ 1D Analysis
#ENA The main support that you might be able to consider to start buying back from here with a short -term target of at least 10%+ from here.

ENAUSDT 2DENA ~ 2D Analysis
#ENA Buy gradually after re -testing this support with a short -term target of at least 15%+ from here.

ENA Fakeout ConsolidationENA cant breakout trendline and create fakeout like before
if ENA can't close above trenline we will see another rug like before

ENA Possible Head and ShouldersENA might be forming an head and shoulders formation which could cause a significant drop in value.
Be careful if the level of 0.34 breaks. It's also a great short opportunity.
Thanks for reading.

ENA 1D TRIGGER SETUP BINANCE:ENAUSDT is showing signs of a potential reversal.
Price just swept local lows into a 1D FVG zone — now we watch for confirmation.
Setup:
🔹 Price tapped into daily imbalance (1D FVG)
🔹 Structure forming around key trigger: $0.369
📌 If the daily candle closes above $0.3692, a bullish reversal gets confirmed
🎯 Target = $0.70 — major liquidity zone & former consolidation area
⚠️ Below trigger = no trade — wait for clean retest and confirmation
This is how fear-based bottoms often form — with structure, not emotion. Let it prove itself.

$ENA - Scalp Long Trade IdeaENA | 2h
0.328 appears to be the local resistance level here
If we can get a valid swing point retest around 0.31-0.305, we'll considering to long targeting the bearish order block above
Setting stoploss just below 0.29
Targets:
0.347
0.379 (bearish order block)
0.392

ENA/USDT Price Analysis📌 About ENA Token
ENA is the native token of Ethena, a decentralized synthetic dollar protocol built on Ethereum. Ethena aims to provide a stable, scalable, and censorship-resistant crypto-native alternative to traditional stablecoins. The token is used for governance, staking, and liquidity incentives within the Ethena ecosystem.
📉 ENA/USDT Price Analysis (4H Chart on Binance)
🔎 Market Overview
🔹 Current Price: $0.3194
🔹 Recent High: $0.3420 (Resistance)
🔹 Recent Low: $0.2907 (Support)
🔹 Volume: 3.56M (High volume at recent dip, showing potential buyer interest)
📈 Bullish Factors:
✅ Short-Term Bounce: The price has rebounded from the $0.2907 support level, indicating buyers stepping in.
✅ Moving Average Support: The yellow line (short-term MA) is beginning to turn up, suggesting early bullish momentum.
✅ Key Resistance at $0.3420: If ENA breaks this level, it could move towards $0.3509 - $0.3718.
⚠ Bearish Risks:
❌ Overall Downtrend: ENA is still trading below the blue (medium-term) and green (long-term) moving averages, which could act as resistance.
❌ Lower Highs Pattern: The recent price structure suggests a potential bearish continuation unless it breaks above $0.3420 - $0.3509.
❌ Potential Drop to $0.2907 - $0.2530: If ENA gets rejected at resistance, a lower move to the major support around $0.2907 or even $0.2530 is possible.
📊 Possible Scenarios:
1️⃣ Bullish Case (Breakout Above $0.3420)
If ENA breaks and holds above $0.3420, the next targets are $0.3509, $0.3718, and possibly $0.3942.
A breakout confirmation would signal trend reversal.
2️⃣ Bearish Case (Rejection & Drop to Support)
If ENA fails to break $0.3420, expect a pullback to $0.3106 - $0.3060 first.
If those supports fail, ENA could retest $0.2907 and possibly drop further to $0.2530.
💡 Trading Strategy:
📌 Long Entry: If ENA breaks $0.3420, target $0.3718 - $0.3942.
📌 Short Entry: If rejected below $0.3420, look for shorts targeting $0.3106 - $0.2907.
📌 Stop Loss: Set below $0.2907 for long trades and above $0.3420 for short trades.

ENA Trade IdeaSame trade setup on MIL:ENA but on a slightly LTF. This will only work in confluence with $BTC. If CRYPTOCAP:BTC is hitting support level and MIL:ENA hits this level. It will be a good scalp.
ENA About to Collapse or One Last Rally Before the Fall?Yello, Paradisers! Is ENA about to crash hard, or is a sneaky rally waiting to trap late bulls? Read this before making your next move!
💎#ENAUSDT has recently formed a Change of Character (CHOCH) while leaving behind a supply zone and an imbalance. Currently, we expect an upside correction toward $0.4333 and $0.4507, but this move is likely to be short lived. If the price taps these levels and faces strong resistance expect a sharp rejection, especially with the descending trendline and EMA 50 acting as barriers to bullish momentum. This setup suggests ENA is in a prime position for further downside unless it breaks above the supply zone.
💎If #ENAUSD fails to break the supply zone, a rapid sell-off toward the $0.34 support zone is highly likely. A visible gap imbalance further increases the probability of the price filling the gap before any potential reversal. Volume analysis also shows a clear surge in bearish activity, confirming strong selling pressure in the market.
💎The $0.34 level remains the most crucial support where buyers may attempt to step in. However, if this fails to hold, the next major demand zone sits around $0.30, where a deeper correction could unfold. Until a significant bullish breakout occurs, the risk of further downside remains high.
💎If the price manages to break above the supply zone, it would invalidate the bearish setup and could fuel a stronger rally. However, as long as the descending trendline and EMA 50 continue to hold back bullish momentum, the bearish outlook remains intact.
💎Will ENA hold support or break down further? Drop your thoughts in the comments! Are you positioning yourself for a move, or are you waiting for confirmation? Let’s discuss!
Stay sharp, Paradisers! The market rewards patience, discipline, and strategic thinking. Trade smart.
MyCryptoParadise
iFeel the success🌴

ENA - Beautiful Easy Signal/TA.signal was given hours ago to my group.
Easy instant money 3.5% 🎯 👌
The new blue marked daily level is another level.
If it breaks (volume TA too), then Short the sht out of it ...
Follow for more ideas/Signals. 💲
Look at my other ideas 😉
Just donate some of your profit to Animal rights and rescue or other charity :)✌️

ENA - What a Beautiful Signal/TAI gave a signal in group (forgot to share here in TV :/ )
Short gave almost 7% 👌 🎯
Follow for more ideas/Signals. 💲
Look at my other ideas 😉
Just donate some of your profit to Animal rights and rescue or other charity :)✌️

#ENA/USDT#ENA
The price is moving within a descending channel on the 1-hour frame, adhering well to it, and is heading for a strong breakout and retest.
We are experiencing a rebound from the lower boundary of the descending channel, which is support at 0.3530.
We are experiencing a downtrend on the RSI indicator, which is about to break and retest, supporting the upward trend.
We are looking for stability above the 100 Moving Average.
Entry price: 0.3700
First target: 0.3820
Second target: 0.3950
Third target: 0.4118

ENA, $.80 EOYENA setting up to for a nice bottoming pattern and run up to ~.80 area by the end of year barring no economic fallout

Bearish Outlook for ENA: Potential Downward TrendHello everyone! 👋
I hope you're all doing well. I wanted to share my thoughts on ENA and provide my perspective on the current market situation. Here's my outlook:
The price of this coin is exhibiting signs of weakness, suggesting it may face further downward pressure. Recent price action has broken through key support levels, while momentum indicators are pointing to a continuation of the prevailing downtrend.
If the broader market sentiment remains negative, we could see further declines toward the next major support zones. While potential rebounds are always a possibility, the overall trend currently appears to favor the bears.
Stay vigilant and manage your risk accordingly.
Best regards! BINANCE:ENAUSDT

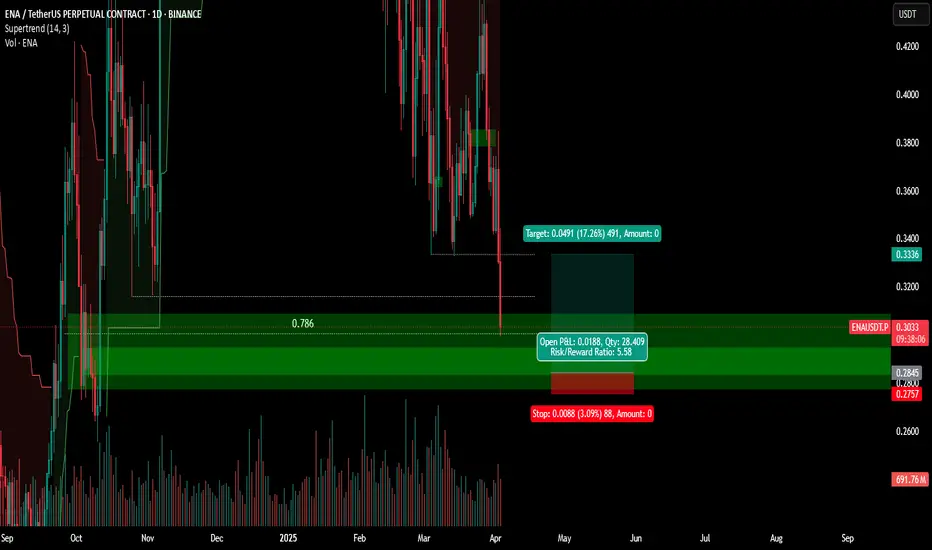
ENA/USDT Analysis: A great opportunity for a speculative longThis asset has broken an important sell zone and consolidated above it, forming a strong volume zone below at $0.415-$0.408. On a retest of this zone, we will monitor the reaction. If confirmation appears, we open a long position with the potential to break above the $0.48 level.

ENA Breakout Setup – Targets at $0.60, $0.76, $0.97, and $1.26The ENA/USDT daily chart shows a descending triangle formation with price currently testing the upper resistance trendline around $0.419. A breakout above this level could trigger a strong bullish move. The RSI (14) is hovering around 53, suggesting building momentum from the bulls.
Once the breakout is confirmed, we could see a rally toward the key resistance levels and Fibonacci extension targets at:
• $0.6072
• $0.7665
• $0.9776
• $1.2662
Additionally, a successful breakout could lead to a retest of the 200 EMA, potentially flipping it into support and signaling a longer-term trend reversal.
Trade Setup:
• Entry: After confirmed breakout above triangle resistance
• Stop Loss: Below $0.36 support zone
• Take-Profit Targets: $0.6072 / $0.7665 / $0.9776 / $1.2662
• Timeframe: Daily
Always manage your risk and wait for confirmation before entering the trade.

#ENA: Powering Decentralized Finance SolutionsDescription:
This trading idea focuses on ENA, a cryptocurrency designed to enhance the efficiency and scalability of decentralized finance (DeFi) applications. ENA plays a key role in facilitating seamless transactions, liquidity provision, and governance within its ecosystem, aiming to solve issues like high fees and slow transaction speeds. As DeFi continues to expand, ENA could benefit from increased adoption, strategic partnerships, and innovative use cases that strengthen its position in the market.
Despite its strong fundamentals, the cryptocurrency market remains highly volatile, influenced by factors such as regulatory developments, macroeconomic trends, and investor sentiment. As with any investment, trading ENA requires a well-planned risk management strategy.
Disclaimer:
This trading idea is for educational purposes only and should not be considered financial advice. Trading cryptocurrencies like ENA involves significant risks, including the potential loss of your entire investment. Always conduct thorough research, assess your financial situation, and consult with a financial advisor before making investment decisions. Past performance is not indicative of future results.

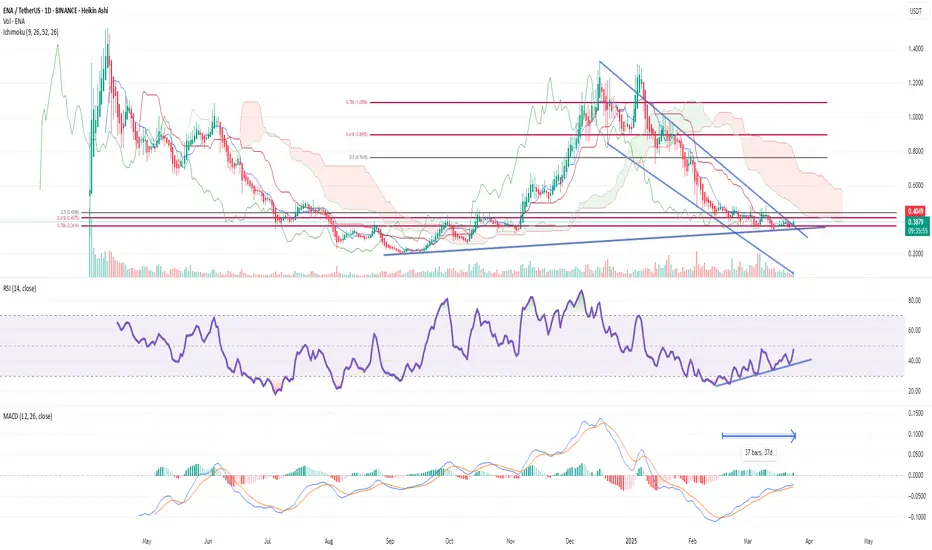
ENA/USDT BreakoutSince ENA/USDT is consolidating at a strong daily support zone ($0.36 - $0.38) and showing bullish divergence on both RSI and MACD, you can look for a buying opportunity near this range.
The falling wedge breakout on D1 suggests that the market may be preparing for a short-term rebound. However, because the price is still under the Ichimoku cloud on D1 (meaning the main trend is still bearish), this trade should be treated as a short-term bounce, not a trend reversal yet.
My advice is:
Wait for a daily candle to close clearly above $0.38 - $0.40 with increased volume to confirm momentum.
If this happens, you can target the $0.44 - $0.45 area for a quick take profit.
If the breakout is strong enough, holding part of the position towards $0.49 is reasonable.
Place a stoploss just below $0.35 to protect against downside risk.
Be cautious, as if the price fails to hold above $0.36 and drops below $0.35, it could revisit lower levels like $0.32 - $0.33. So, proper risk management is key.
FireHoseReel | $ENA AnalysisWelcome to FireHoseReel!
Weekly Timeframe
BINANCE:ENAUSDT coin is currently at its strong demand zone on the weekly time frame, and it could potentially experience a pump from this area.
Let's check the lower time frames as well to find the best entry point!
Daily Timeframe
On the daily time frame, we have refined the weekly zone.
The price is currently at this zone, and there is significant liquidity to place targets, including liquidity voids and highs.
We also expect the start of the price's substructure phase on the daily time frame and the start of the minor phase on the weekly time frame.
4H Timeframe
On the 4-hour time frame, we are looking for our entry.
We have a demand zone where the price has reversed and turned bullish(CH).This zone also has a lot of liquidity above it, which serves as confirmation for our zone.
This zone will be a good entry point for a long trade.
Our target will be 0.5$ then 0.75$.

$ENA🚀 MIL:ENA Analysis
📊 Daily Timeframe:
📉 Falling Wedge Formation – A potential bullish reversal pattern developing.
👀 Keep an eye on a breakout for confirmation!

ENA/USDT: 100% PROFIT POTENTIAL TRADE SETUP!!🚀 Hey Traders! ENA Breakout Alert – 100% Move Incoming? 👀🔥
If you’re excited for this setup, smash that 👍 and hit Follow for premium trade ideas that actually deliver! 💹🔥
🔥 ENA/USDT – Breakout & Retest in Play! 🚀
ENA has broken out of a falling wedge and is now retesting the breakout level. With momentum building, it looks poised for a massive 90-100% upside move from here! 💥
💰 Trade Setup:
📍 Entry: CMP, add more up to $0.36
🎯 Targets: $0.46 / $0.58 / $0.66 / $0.77
🛑 Stop-Loss: $0.325
⚡ Leverage: Low (Max 5x)
🔎 Strategy:
Enter with low leverage now
Add more on dips and ride the breakout momentum higher 🚀
💬 What’s Your Take?
Are you bullish on ENA’s potential for a 100% move? Share your analysis, predictions, and strategies in the comments! Let’s crush it together and lock in those gains! 💰🚀🔥

ENA - Beautiful Signal Gave Us 3 Nice Shorts.The VAH gave u 3 Shorts.
👌 🎯 3 % + 5 % + 2 %
The TA/Signal was given days ago here:
Follow for more ideas/Signals. 💲
Look at my other ideas 😉
Just donate some of your profit to Animal rights and rescue or other charity :)✌️
