ENA Swing Buy / Long Setup ENA looking too strong, I'm already in from 0.67$, will book some on 0.75-0.85, and will add some more margin if it comes to again on my entry which is breaker & fvg area. I took eth, doge, griffain, link and inj long. All are running on good profits. If you wanna join me for free contact me on tg, I have no paid group etc. tg @sstradingtg
ENAUST trade ideas

Ethena Showing Strength, Poised for 20% Rally to $0.99Hello✌️
Let’s analyze Ethena’s price action both technically and fundamentally 📈.
🔍Fundamental analysis:
Ethena’s USDe hit $10B market cap in 500 days, helped by U.S. rules limiting yield on other stablecoins. Institutional demand for its DeFi-based returns could lift ENA’s role and value. 💹
📊Technical analysis:
BINANCE:ENAUSDT is showing exceptional strength with strong volume, solid Fibonacci support, and a key daily trendline 📈. These technical factors suggest a potential 20% upside targeting $0.99 🚀.
✨We put love into every post!
Your support inspires us 💛 Drop a comment we’d love to hear from you! Thanks, Mad Whale

ETHENA Potential Double Bottom Setup UnfoldingEthena (ENAUSDT) is currently developing a possible double bottom reversal structure, with price rebounding firmly from the lower boundary zone. This key support has now produced a bullish reaction, guiding price action toward the upper neckline resistance of the pattern.
A successful breakout above the neckline will confirm the double bottom formation and validate the bullish reversal scenario. This setup aligns with classic accumulation behavior often seen at market bottoms. If confirmed, the projected targets have been clearly mapped on the chart for your strategic positioning and risk management.
Watch the neckline zone closely it holds the key to short-term trend reversal or continued range behavior.
Share your thoughts in the comments.

Ethena (ENA) Bullish Structure Intact as EMA Confirms UptrendBINANCE:ENAUSDT continues to flash bullish technicals. A 50-day/100-day EMA crossover just confirmed, while the 100-day is nearing the 200-day; a setup that previously led to sustained rallies. ENA also trades inside a well-formed ascending channel, currently challenging resistance at $0.65. A clean breakout could push the price toward $0.70, with the full channel breakout target set near $1.13 (1.618 Fib extension).
Backing the structure is a bullish OBV divergence: while BINANCE:ENAUSDT price made a lower high, volume momentum made a higher high, indicating hidden accumulation. Meanwhile, whale wallets increased holdings by over 30% in 7 days, showing institutional support. Support holds near $0.60, and a break below would invalidate the bullish thesis.

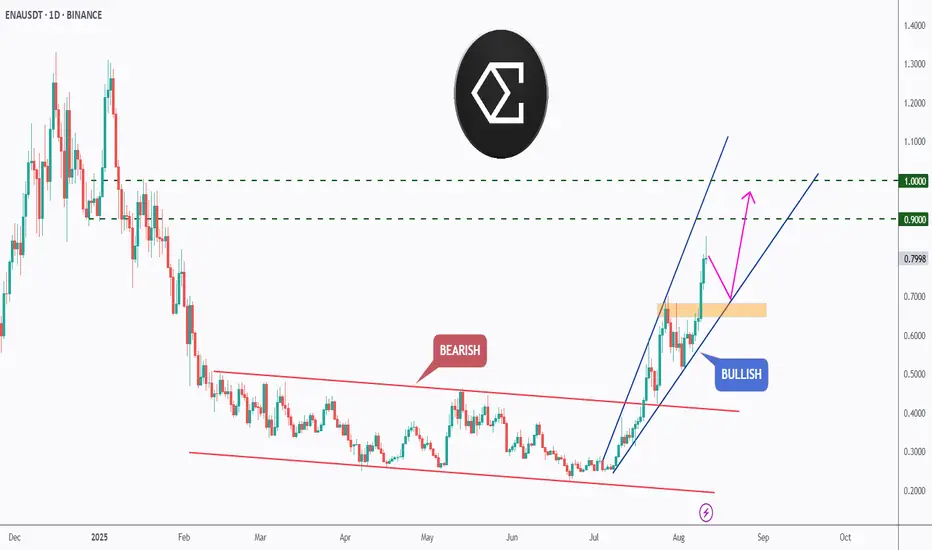
[Deep Dive] ENA – Edition 5: From Channel Break to $1?BINANCE:ENAUSDT ENA has just completed one of the cleanest bullish breakouts we’ve seen this month — transitioning from months of compression inside a bearish channel to an aggressive impulsive rally.
📉 Bearish Phase
For most of 2025, ENA traded within a descending parallel channel, stuck in a cycle of lower highs and lower lows. Momentum was firmly in the bears’ hands, and every rally attempt was quickly rejected at the channel’s upper bound.
📈 Bullish Breakout
In late July, the tide shifted. Price broke decisively above the channel, retested the breakout zone, and entered a steep ascending channel. This bullish structure is now guiding price toward the $0.90 and $1.00 resistance zones — key psychological and technical targets.
The current move has left an orange demand zone ($0.70–$0.72) in its wake, which could act as a magnet for a healthy retest before another push higher.
🔥 Fundamental Tailwinds
ENA (Ethena) has been making headlines in the DeFi yield space with its synthetic dollar protocol USDe, offering stable and high on-chain yields. Recent updates include:
Expansion of USDe collateral integrations across major DeFi protocols.
Strategic partnerships with lending and derivatives platforms, increasing USDe’s utility.
Continued growth in circulating USDe supply, signaling strong adoption.
As yields and DeFi activity heat up, ENA could continue to attract liquidity — especially with narratives around on-chain stable yields gaining momentum.
🧠 Key Levels to Watch
- Support: $0.70–$0.72 (demand zone)
- Immediate Resistance: $0.90
Major Breakout Target: $1.00 — a key round number and potential profit-taking zone.
A clean retest of the orange zone followed by bullish confirmation could offer one of the best risk-to-reward entries in weeks.
💬 What’s your take — will ENA clear $1 on this run, or does it need a deeper pullback first?
🔔 Disclaimer: This analysis is for educational purposes only and does not constitute financial advice. Always do your own research and manage risk accordingly.
📚 Always follow your trading plan regarding entry, risk management, and trade management.
Good luck!
All Strategies Are Good; If Managed Properly!
~Richard Nasr
Ethena Poised for 29% Rally Toward Crucial 0.75 Target Hello✌️
Let’s analyze Ethena’s price action both technically and fundamentally 📈.
🔍Fundamental analysis:
Every $1B rise in USDe means more demand for ENA tokens as collateral. With $290M revenue, ENA shows strong, steady growth potential 🚀.
📊Technical analysis:
BINANCE:ENAUSDT is approaching a critical daily support zone that also coincides with a key level on the daily chart 📉. If this support holds firm, we could see a strong 29% rally toward the 0.75 target 🎯. This setup offers a clear risk-reward for traders watching closely.
✨We put love into every post!
Your support inspires us 💛 Drop a comment we’d love to hear from you! Thanks, Mad Whale

ENA short to $0.4910Just now opened a short on ENA. Aiming for $0.4910
Seems likely to dump further based on DTT analysis- Learn more on X.
Sl: $0.5435
Roughly 2 RR from my entry

ENA / USDT#ENA / USDT
Iam expecting big returns from ETH and its related coins in this season
This chart is also looking good
Another Potential round bottom pattern under formation
Keep an eye

#ENAUSDT In a simple weekly view,
it is quite clear that a break of the red arrow resistance line will pave the way for a touch of the ceiling,
so watch and wait.

Ena short back to 0.51 this week0.6060 stoploss
Market likely to start falling soon based on my DTT analysis. Structurally price is high overall , started to break back below 4hr support levels, downtrend on 1hr tf and high on daily tf

ENAUSDT tradeWe can see how a bullish flag is formed on ENAUSDT. I opened a position close to upper line expecting to see a pump since BTC.D started forming downtrend and bounced from a strong resistance 62% level and EMA-200 on 1-D chart
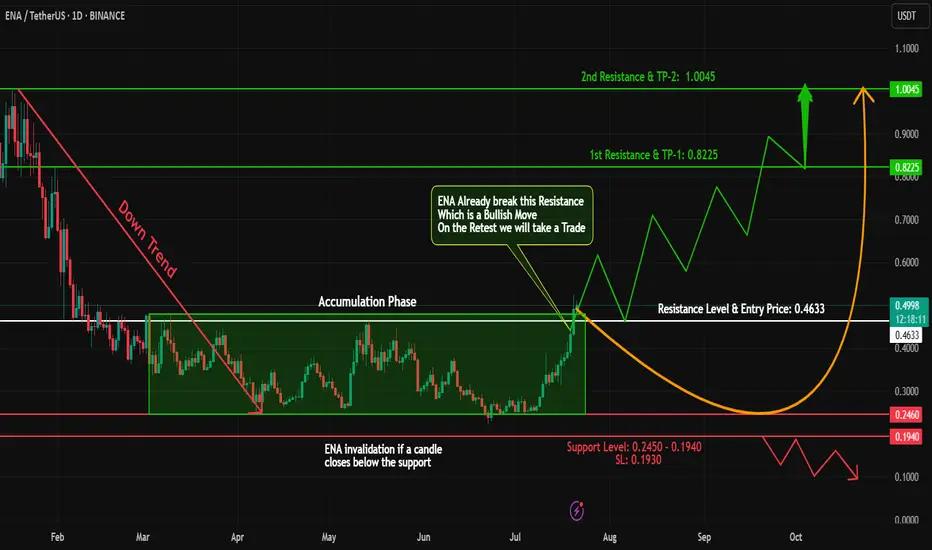
ENA Breakout Alert – Bullish Opportunity Ahead!#ENA has shown a classic accumulation + breakout structure!
🔹 Phase 1: Downtrend – From 1.00 to 0.25, #ENA went through a steep correction.
🔹 Phase 2: Accumulation – Price consolidated for a while, forming a strong base.
🔹 Phase 3: Breakout – #ENA has now closed a daily candle above the accumulation zone – a strong bullish signal!
📊 Trade Plan:
✅ Long Entry: At CMP or on a retest of the breakout zone
🎯 Targets: 0.80 - 1
🛡️ Stop Loss: Just below the accumulation zone
⚠️ Risk Management is key – stay smart and disciplined!
💬 What’s your take on #ENA’s next move? Share your thoughts below!
🧠 Follow for more breakout setups, trend analysis & educational content.
#ENA #CryptoBreakout #Accumulation #Altcoins #TradingView #CryptoAnalysis #TechnicalAnalysis #TrendReversal
ENAUSDT Bearish Reversal Setup From Key Resistance ZoneTrade Setup Analysis
- Timeframe: Daily (D1)
- Position Type: Short (Sell)
Entry Point: 0.8573
The entry is placed at a significant resistance level, positioned between the profit zone (green) and the risk zone (red), aiming to capture a potential downward move from this area.
Stop Loss (SL): 0.9630
Placed above the key resistance to protect against a breakout. A breach of this level would invalidate the bearish thesis. Risk exposure is approximately +12.33% from entry.
Take Profit (TP): 0.5390
Target set at a strong previous support level, offering a potential downside of around -37.13% from entry.
Risk/Reward Ratio: 3.01
A favorable setup with three times the reward potential compared to the risk.
Technical Outlook:
ENAUSDT has shown a sharp upward rally but is now approaching a major resistance zone. This area could trigger profit-taking, potentially leading to a retracement toward lower support levels.
Bearish Scenario: Sustained rejection at 0.8573 may drive the price down toward the 0.5390 target.
Bullish Invalidation: A confirmed breakout and close above 0.9630 would nullify this setup, potentially signaling further bullish continuation.
Summary:
This setup takes advantage of a potential reversal at a critical resistance point, with clear risk management and a well-defined target. Monitoring price action around the entry zone will be key to confirming the sell signal.

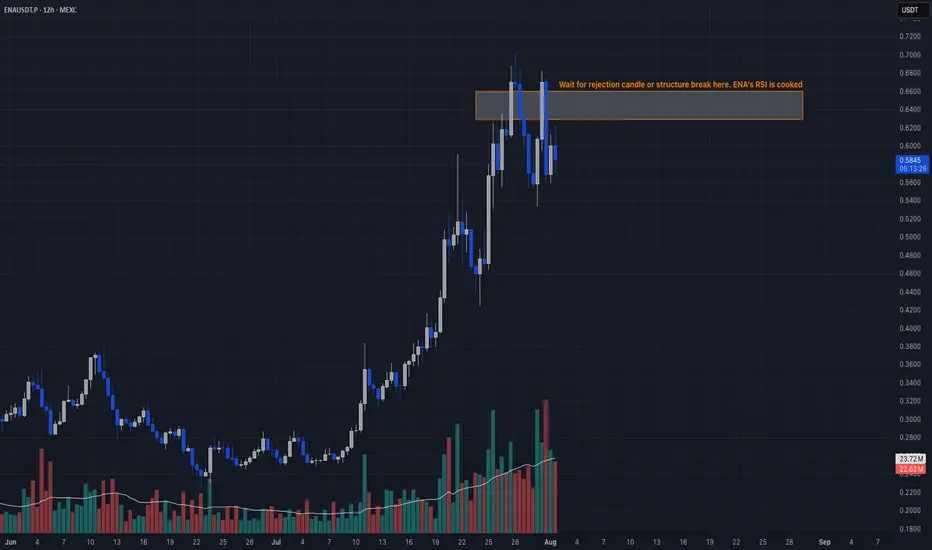
Overbought + Reversal Signal📣 Yo legends!
ENA got jacked on steroids lately, exploding in TVL and open interest like it’s headed to $10. But RSI at 82? Declining OI? That’s not strength, that’s a leverage hangover waiting to happen. Time to fade the party. 🥴
🔥 TRADE SETUP
Bias: Short
Strategy: Overbought + Reversal Signal
Entry: $0.63 – $0.66
SL: $0.71
TPs: $0.5446, $0.50, $0.42
Why?
– RSI 82 on daily = overheated
– Open interest dropping fast after topping $1.35B
– Funding collapsing → longs unwinding
– HTF sweep + LTF CHoCH confirmed.
Candle Craft | Signal. Structure. Execution.
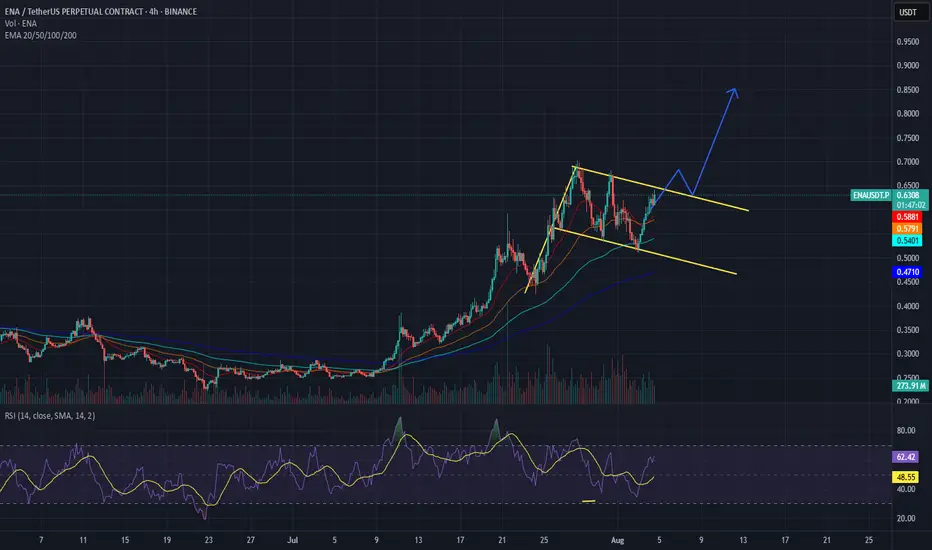
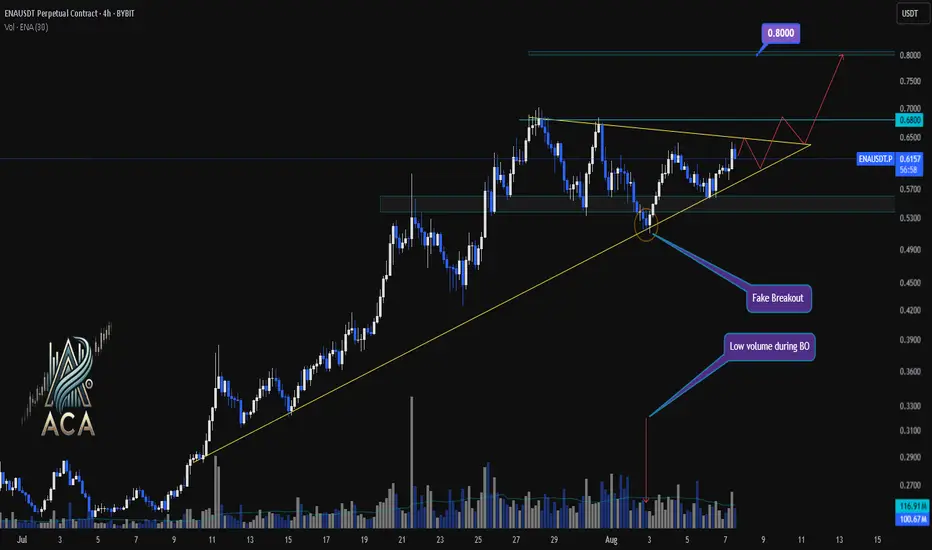
ENAUSDT 4H Chart Analysis | Bullish Breakout Setup in FocusENAUSDT 4H Chart Analysis | Bullish Breakout Setup in Focus
🔍 Let’s dive into the ENAUSDT perpetual contract and analyze the recent price action, spotlighting key technical signals and a potential breakout scenario.
⏳ 4-Hour Overview
The 4-hour chart shows ENAUSDT consolidating above a critical ascending trendline, with price action tightening into a symmetrical triangle formation. Multiple attempts to break down have resulted in a fake breakout, as indicated by low volume during the breakdown — a classic sign of seller exhaustion.
🔺 Bullish Breakout Setup:
On the upside, a confirmed breakout above the $0.6800 resistance could pave the way for a bullish continuation towards the $0.8000 target zone. The structure suggests increasing buying pressure as long as price holds above the trendline and key support ($0.6050).
📊 Key Highlights:
- Price retested the ascending trendline; buyers defended it aggressively.
- A fake breakout with low volume suggests trap for bears and quick recovery by bulls.
- The next major resistance comes at $0.6800, with a projected target at $0.8000 upon breakout.
- Short-term support sits at $0.6050. Price action above this level remains constructive.
🚨 Conclusion:
Watch for a decisive move beyond triangle resistance. A high-volume breakout above $0.6800 could trigger a sharp move toward $0.8000. Bulls are building momentum — keep an eye on volume to confirm breakout strength.
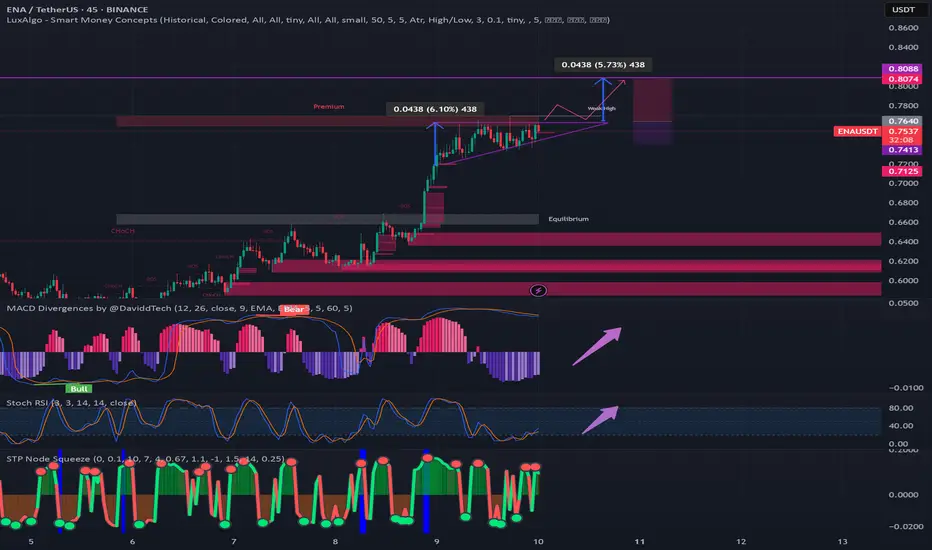
ENA possible Ascending triangle breakout playLook for confirmation above the Resistance line in Pink... maybe wait for a breakout, then a pullback touching the Prior Resistance line before entering... and then note the size of the triangle as a possible TP zone.
It is however, Entirely possible that the structure falls apart as a candle deviates from this pattern and falls to the bottom... just be careful on your entry.
Not Financial Advise... duh..
#ENA #scalptrade #leveragetrading #leveragetrade #eth BINANCE:ENAUSDT.P
ENA Breakout Alert – Red Resistance Cleared! 🚨 MIL:ENA Breakout Alert – Red Resistance Cleared! 🔴✅
MIL:ENA has finally broken out of the red resistance zone.
📊 This breakout signals bullish momentum with potential for further upside.
🔥 Buyers stepping in strong —

ENA Faces Strong Selling Pressure, Bulls Struggle to Hold GroundENA/USD shows a bearish shift in market sentiment on the daily chart. The Balance of Power (BoP) indicator has turned negative, currently at -0.35, suggesting that sellers are firmly in control and outweighing buying interest.
The BoP reflects the strength between buyers and sellers, indicating who holds the upper hand over a given period. A negative reading signals that selling pressure is driving prices lower, with sellers overpowering any bullish attempts to push the market upward.

Ethena Bullish Momentum Builds, Eyes 30% Rally to $0.85Hello✌
Let’s analyze Ethena’s upcoming price potential 📈.
BINANCE:ENAUSDT has demonstrated strong bullish momentum recently, supported by positive fundamental developments 📈. The price is currently near key daily and Fibonacci support levels. If these hold, a potential 30% upside targeting $0.85 looks likely 🚀.
✨We put love into every post!
Your support inspires us 💛 Drop a comment we’d love to hear from you! Thanks , Mad Whale

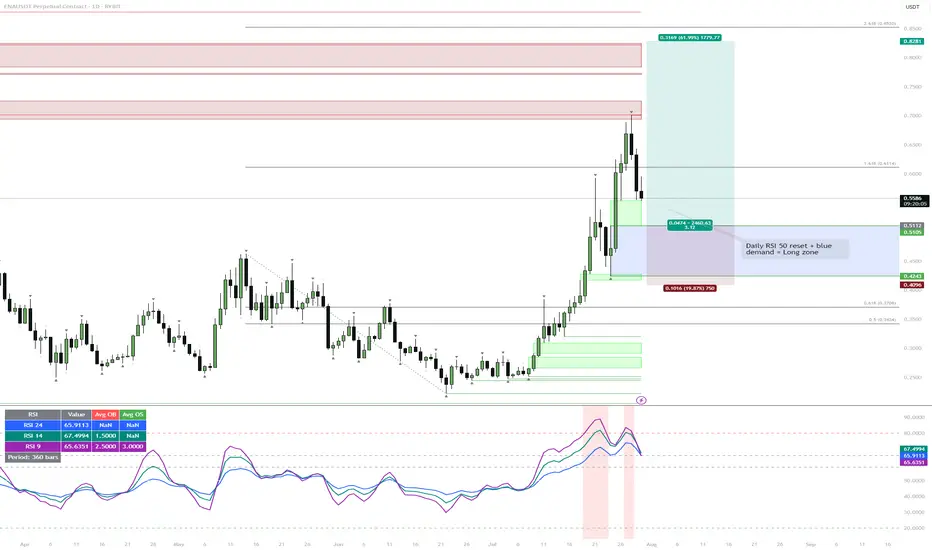
ENA | Waiting for the Daily RSI 50 ResetWatching for price to drop into the blue demand zone while the daily RSI resets to the 50 level. If both conditions align, that's the next high-probability long setup.
Reasoning:
Strong rally has left RSI elevated, so a cool-down is likely.
The blue zone lines up with the prior breakout and consolidation, so it's a logical area for buyers to step in.
A confluence of demand and neutral RSI usually provides the best R:R for trend continuation.

ENA/USD: BBTrend Suggests Latent Bullish Momentum UnfoldingSince June 29, the BBTrend (Bollinger Band Trend) indicator on ENA’s daily chart has shown a steady series of growing green bars. This expansion signals increasing underlying bullish momentum, even as the token’s price trended mostly downward over the past week.
However, today’s 10% rally marks the strongest upside move in that entire period—potentially signaling the start of a reversal. In technical terms, when BBTrend bars expand during price consolidation, it often precedes a breakout. That appears to be playing out now. If this renewed momentum sustains, ENA could be setting up for further upside in the sessions ahead.

Long ENAbuy at monthly open range 0.3-0.4 btw
RSI sLH
Strong fundamental coin
wait and accumulate
last Chance buy now Lock in DYOR
