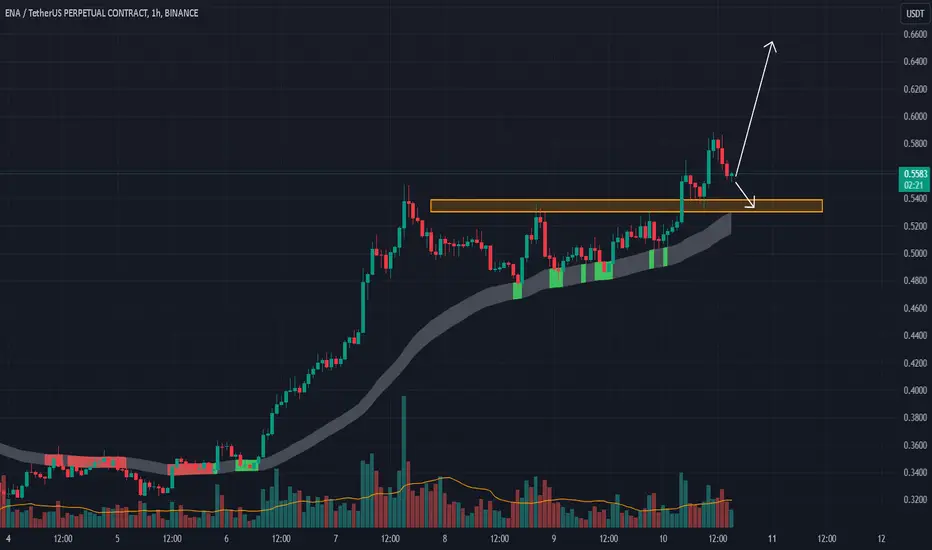
ENA/USDT Potential Pullback to Trendline Support Before ResumptiThe ENA/USDT daily chart shows a potential pullback scenario to a significant upward trendline support before continuing the bullish trend. The current structure suggests healthy consolidation after the recent rally.
Key Observations:
Trendline Support: The green upward trendline has consistently supported the price since the beginning of the uptrend, indicating its importance as a key level.
Bollinger Bands: Price is currently consolidating near the upper band, with a likelihood of retracing toward the middle band or trendline for mean reversion.
Support Zone: A potential pullback to the range of 0.53–0.54 aligns with the trendline and provides a solid re-entry point.
Trade Plan:
Entry Strategy:
Enter long positions within the 0.53–0.54 support range, awaiting confirmation with bullish candlestick patterns or increasing volume.
Stop Loss:
Place stop loss below 0.52 to protect against a breakdown of the trendline.
Take Profit Levels:
First Target: 0.58 (recent local high).
Second Target: 0.60–0.62 (next resistance zone and upper Bollinger Band area).
This analysis assumes the continuation of the bullish trend, supported by volume and overall market structure. Monitor for increased selling volume to adjust the plan if necessary.
ENAUST trade ideas

$ENAUSDT going new ATHBINANCE:ENAUSDT
This coin will perform well in this cycle. A very strong team and a very good prospect to fly to the overhang.
Targets are on the chart. Adding to the portfolio.

ENA (Ethena) The recent price movement of ENA (Ethena) has shown exciting technical shifts, particularly after attempting to break out of a long-standing price channel four times. This repeated testing of resistance typically indicates strong buying pressure and potential momentum toward higher price levels. With the price channel finally breaking, ENA has surged toward a target range of $2-$5 This upward movement suggests increased investor confidence and bullish sentiment, often seen when technical resistance is overcome after multiple attempts.
A price target of $5 is ambitious, yet plausible, given the increased interest and potential fundamental factors supporting ENA. However, as with all crypto investments, this analysis should be viewed as a technical observation and not financial advice, as the market remains highly volatile and subject to rapid changes based on external influences.

ENAUSDTHMT v1.0 spotted. Looking good with previous wave up with increasing volume and momentum.
- BOS (Breaks of Structure) at @ 0.5303-0.5389 level
- Trending slow and steady if able to hold above the BOS level
It is at extremely good reward to risk level.
ENA/USDT Short Opportunity - Channel Resistance Test!📉 ENA/USDT Short Opportunity - Channel Resistance Test!
Timeframe: 1H
Current Price: 0.4964 USDT
Trade Type: Short
Chart Analysis: ENA/USDT is trading within a clear upward channel, with the current price action testing the upper trendline. This level has shown resistance in the past, increasing the probability of a pullback within the channel.
Resistance Level: The upper channel boundary near 0.5000 is a strong resistance zone, as seen in previous attempts to break above it.
Support Level: The lower boundary of the channel, currently around 0.4250, could act as a support target if the price reverses.
Trade Setup:
Entry Point: Short entry around the current price, near 0.4950.
Stop Loss: Place just above the resistance line, around 0.5050, to allow some buffer.
Take Profit: Target the lower channel boundary around 0.4250, aligning with the channel's support trendline.
EMA Insight:
The price is above the 200 EMA (0.4165), indicating a bullish overall trend, but this trade capitalizes on a potential short-term retracement within the channel.
Conclusion: This short setup within the channel offers a favorable risk-to-reward ratio. However, watch for any significant breakouts above resistance, which could invalidate the setup.
Trade Safe!

ENAUSDT Buy opportunityENAUSDT experienced a significant decline after being rejected from the important supply zone mentioned in our previous analysis.
The drop has been substantial, leading us to believe that it has now reached a strong demand area. The provided demand zone presents a favorable opportunity for buying accumulation. We would appreciate hearing your perspective on this coin.

ENA USDTENA chart shows the price behavior within a descending channel. The price has been respecting the channel boundaries, with each peak and trough aligning with the upper and lower trendlines. The price of ENA has been rejected from the upper boundary of the descending channel and the resistance zone (Green) at $0.4203 - $0.4462 many times.
Everything is on the chart

Here's the latest update on #ENA:Here's the latest update on #ENA:
An Inverse Head & Shoulders accumulation pattern has been fully formed, and the price is currently testing the neckline, indicating potential bullish momentum. 👀
A breakout at this point would signal a significant upward move. ✈️
Note: GETTEX:ENA is part of the Ethereum ecosystem, adding to its potential appeal and strength. 🔥
Price Targets:
🎯 Short-term target: $0.7630
🎯 Mid-term target: $1.1265
🎯 Long-term target: $2.3380

#ENA/USDT#ENA
The price is moving in a descending channel on the 4-hour frame upwards and is expected to continue.
We have a trend to stabilize above the moving average 100 again.
We have a downtrend on the RSI indicator that supports the rise by breaking it upwards.
We have a support area at the lower limit of the channel at a price of 0.33100.3800.
Entry price 0.2800.
First target 0.4174.
Second target 0.4435.
Third target 0.4637.

ENA (ENA/USDT) Technical Analysis – November 2024ENA (ENA/USDT) Technical Analysis – November 2024
The chart indicates that ENA has broken out from a descending wedge pattern, suggesting the potential for a strong bullish reversal.
Key Observations:
Current Price: $0.5279 (+50.27%)
Resistance Targets:
First Target: $0.8921
Second Target: $1.2159
Third Target: $1.5664
Technical Pattern: The breakout from the descending wedge, a pattern typically signaling a reversal from bearish to bullish, supports a potential upward trend if volume and momentum continue.
Next Steps:
Watch for price action around the $0.8921 level to confirm continued momentum. A retest and hold above this level could propel ENA to the next targets of $1.2159 and $1.5664.
#ENA #Crypto #TechnicalAnalysis #Breakout #PriceTargets

$ENA had the most promising setupI just have the chance to share this setup. Now it is perfectly align and will continue its long term target back to $1.

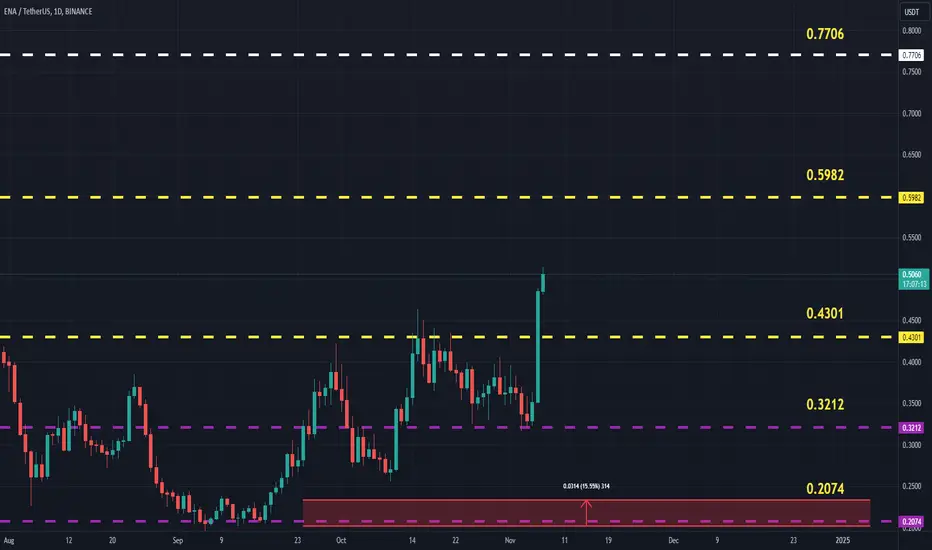
ENAUSDT (Ethena) Updated till 07-11-24ENAUSDT (Ethena) Daily timeframe range. PA got lots of space to move around here. if the candle above 0.4301 dont get invalid it can get to 0.5982 or above depends on volume. but for that it needs to hold 0.4301. recent support at 0.3212.
#ENAUSDT (11-2024) Ethena (ENA) Price Analysis
Price: $0.42
Support Level: $0.32
Resistance Level: $0.51
Technical Indicators: Ethena continues forming higher lows, indicating a bullish trend. RSI is above 60, suggesting positive momentum and potential for further gains if the market maintains strength.
Market Overview :
Ethena (ENA) is ranked among the prominent DeFi projects with over $1.5 billion in total value locked (TVL) just months after its February 2024 launch. The ENA token plays a role in governance and in managing risk within the Ethena ecosystem, which is centered around its synthetic stablecoin USDe. This DeFi protocol is designed to operate without dependence on traditional finance, using a delta-neutral strategy to back its stablecoin while maintaining stability during market volatility.
Potential Growth Catalysts A breakout above $0.51 could signal a new bullish wave, pushing prices higher, with mid-term targets of $0.60 to $0.70, if general market conditions are favorable.
With its innovative DeFi approach and strategic partnerships, ENA is positioned for growth in both usage and value as the ecosystem expands. However, a close below $0.32 could indicate potential downside risks, suggesting a re-evaluation of positions.
#ENA Since 19 Sep
When we recommend adding a coin to your watchlist, it's typically due to forming a pattern, nearing a historical bottom, or approaching a strong support level. It may also show increased trading volume, reversal candles, or be in an accumulation stage. While we haven't observed a bullish reaction yet, we advise monitoring it until an optimal entry point emerges.
PS:
We avoid trading coins associated with gambling, prostitution, human trafficking, etc.
Note:
This is not financial advice but an analysis of coin movements. Conduct your own research and practice risk management before making any investment decisions. Remember, the cryptocurrency market carries significant volatility and risks.
Best wishes to all,
we ask Allah reconcile and repay. 🙏

Clear Bearish Setup 👉 The Main Pattern Formed At The Chart Is a Rising Wedge And The Price Rejected From 0.46$ Resistance And Currently Playing Above The Support Line, Expect a Breakdown The Trend Line To The 0.25$ As a Next Target

ENA Trade when price reveal its directionENA is in wave 3 or wave C so it may go up breaking the channel to very bull wave. Otherwise it will respond to the hit of the down trend line to the bottom of the channel.
My strategy is to wait here until the price reveal its direction

ENA contracting triangleI can notice that the ENA is moving in a contracting triangle which generally occurs in wave 4 in the five wave impulse pattern.
I expect the price goes to 0.3823 or higher (truncated triangle).
The target would be 0.4181 when wave 5 = wave 1
or
the target would be 0.4124 which is the triangle height.
It may goes also higher than that or it may not,
Stop loss may be 0.3763 which is the end of wave C in the triangle.
As I always say, use your protective stop and manage your wallet risk
Good Luck
:)

ENA/USDT: Bull Flag Breakout! Strong Bullish Setup in Play!!Hey everyone!
If you’re finding value in this analysis, don’t forget to hit that 👍 and follow for more updates!
ENA is looking strong right now! It is breaking out from the bull flag pattern and a successful retest is also done. Long some at CMP and add more in the dip.
Entry range: CMP and add more up to $0.36
Targets:- $0.44/$0.50/$0.57/$0.64
SL: $0.345
Lev: Use low leverage (Max 5x)
What do you think of ENA’s price action? I’m seeing a strong bullish setup here! Share your insights and analysis in the comments below!

Ethena Update (Inverted Head & Shoulders Pattern Updated)This chart very interesting to update since we looked at it recently. On the chart, I drew the inverted Head & Shoulders pattern. On top of it is line depicting the neckline. We can see how the break above the pattern resulted in a rejection pushing prices below the neckline; bearish.
The RSI is showing some bearish divergence in the short-term and the current candle, which still early, is showing exhaustion.
Now, in the previous trade-idea I showed two scenarios (you can find it by visiting my profile using the search filter to find this pair):
1) Staying above the iH&S patterns would produce a bullish jump right away.
2) Moving below, as it is now, would activate the second scenario with the red arrow follow by the blue one.
I added a second resistance line (green) that would need to break for Ethena (ENAUSDT) to move higher and grow. Based on current market conditions, it seems we have the second scenario, a drop before additional growth.
Patience is key.
There will be strong and clear signals when the bottom is in.
Namaste.

Ethena Labs Under Fire: Alleged Funds Misuse Sparks 6% ENA DropOverview of Allegations and Price Impact
Ethena Labs, an Ethereum-based synthetic dollar protocol, is facing significant community backlash after allegations of fund misuse. The controversy centers around Ethena Labs’ involvement in its own crypto farming event using 180 million XETR:ENA tokens, allegedly manipulating rewards to benefit the organization. Following these accusations, the ENA token’s price has taken a notable hit, crashing 6.01% to $0.33 as investors question the protocol’s transparency and governance.
Details of the Alleged Misuse
The allegations emerged on October 27 when crypto analyst Nomad pointed out that Ethena Labs staked approximately 25% of the total ENA (SENA) supply in its ongoing Season 3 farming event. According to Nomad, the Ethena team used six wallets, which reportedly accumulated significant rewards, including Satoshi points and Ethereal tokens, through interactions within the ecosystem. Observers believe that the staking could dilute the rewards of regular participants and create an ethical dilemma by favoring foundation insiders.
The accusations reveal that these wallets may have received 180 million XETR:ENA tokens from a Coinbase Prime Custody address, previously believed to hold locked tokens for the Ethena Foundation. The debate sparked an intense response from the community, with some questioning Ethena’s governance practices.
In response, Ethena Labs issued a public statement denying the allegations. The team asserted that no locked team or investor tokens were staked to receive rewards, and all ENA tokens in question were sent from foundation wallets following the vesting schedule. To enhance transparency, Ethena Labs announced a UI update, breaking down total sENA eligible for future airdrops and excluding undistributed tokens.
Past Staking Controversies
Ethena’s history with its farming events raises additional concerns. Past staking events, particularly Seasons 1 and 2, reportedly suffered from irregularities, leading some participants to incur financial losses. These recurring issues have led many community members to scrutinize the protocol’s fairness and commitment to ethical governance. For Ethena Labs, maintaining credibility is crucial, given that the protocol manages a substantial $2.6 billion in user funds.
Despite the allegations, Ethena Labs received a confidence boost as Wintermute, a prominent algorithmic trading company, accepted Ethena’s USDe token as collateral for over-the-counter (OTC) trading activities. This acceptance suggests that, while mired in controversy, Ethena’s assets are still gaining traction in broader financial markets.
Technical Analysis
On the technical front, XETR:ENA token is experiencing a downtrend as it currently trades below the 50-day moving average. With a Relative Strength Index (RSI) at 43, the market sentiment remains bearish. ENA’s daily chart reveals a rising wedge pattern, indicating potential downward movement if the price fails to hold within this channel. The token is approaching a crucial support level at $0.17, a breakdown of which could lead to further declines, especially if Bitcoin’s bullish momentum reverses.
With the ongoing scrutiny and allegations, Ethena Labs faces pressure to prove its commitment to fair practices and transparency. If it addresses these issues effectively, the protocol may regain the community’s trust. However, any failure to resolve these concerns could hinder its long-term prospects in the increasingly competitive DeFi landscape.

ENA/USDT: Potential Accumulation Phase on Weekly SupportThe chart suggests that ENA/USDT is currently in a potential accumulation phase, with price hovering around a key support zone on the weekly timeframe. This may indicate a possible bottoming pattern, setting the stage for a bullish reversal.
Detailed Analysis:
Support Zone:
ENA/USDT is trading near the highlighted green support area around the $0.16 - $0.20 range. This zone has acted as a critical support level in the past, absorbing selling pressure and facilitating potential buying interest.
Current Price Action:
The price is consolidating in this zone, indicating a possible accumulation phase, which typically precedes a bullish move.
The recent low volume suggests a lack of selling momentum, which could be a sign of potential bullish interest building up.
Entry Price:
The ideal entry range is around $0.16 - $0.20, given the strong support at these levels. This offers a lower-risk entry point with the potential for a significant upside.
Target Price:
The primary target price for this setup could be around $0.55, which corresponds to a previous resistance level and aligns with potential recovery if bullish momentum picks up.
Key Support & Resistance Levels:
Support: $0.16 - $0.20 (accumulation zone)
Resistance: $0.36 (intermediate resistance), $0.55 (target level)
Risk Management:
Stop Loss: To manage risk, a stop-loss can be placed below $0.15, as a break below this level could invalidate the potential bullish setup.
Trade Plan Summary:
Entry Zone: $0.16 - $0.20
Take Profit: $0.55 (target level)
Stop Loss: Below $0.15
Conclusion:
ENA/USDT appears to be consolidating at a strong weekly support zone, indicating a potential accumulation phase. If the support holds, a bullish reversal toward the $0.55 resistance level is possible.

ENA bullish I expect ENA in it's bull run.
I think ENA will exceed 0.4 and run above to sky.
It is now running in a channel and expecting price to reach the above ceiling of the channel

Enausdt for buy.Price broke out of a falling wedge, retested the previous resistance zone, broke out of the next resistance zone and retested it.

