ENJBTC - Head And ShouldersI can see 2 pattern on this chart;
1. A symmetrical Triangle
2. Head and Shoulders
If the supportline from both patterns break than we might see a -7% drop before next supportline.
I make this charts to learn more about technical analyses, thoughts from others are welcome!
ENJBTC trade ideas


Daily divergence on a fairpumped coinPrices are on support, next to MA200, we have a daily divergence and we're on a fib level.
ENJ is a very bullish coin, with his samsung partnership and my be very bullish if we have another alt season.
Wait for a RSI > 50 on the 4h before entering. This is to confirm we'll start a bullish moove.
Entering before would MAYBE give you a better price, but the risk is way bigger. And by waiting you may have an even better entry. You entry will be safer anyway.

ENJ/BTC possible targetsHi guys!That is my idea for that coin.You can see the possible targets!That is not finnancial advice!
Have a nice trade guys!

ENJ/BTC - 4 Indicators Suggesting a Good Entry.Hello everyone! I hope you're well as usual, today I've discovered an interesting opportunity.
Quick disclaimer: I'm not held accountable for anything you do if you use my charts as trading signals, or a source of financial advice. My posts are simply thoughts and opinions, as well as information that can help educate people or spark discussions.
I'm excited to share with you my first post that isn't about BTC, but instead, an altcoin named ENJ, which is famous for partnering with Samsung.
Here's 4 Indicators I found that maybe worth an entry, let me know what you guys think in the comments below. The list are as follows:
1. Last Support Line at 1988 sats
2. Falling Wedge
3. Level 19 Oversold RSI on the 4 hour chart
4. Risk Management: 4.47-1 trade
1. Support Line
As you can see we've seem to hit the lowest level of support, and it's holding fairly strong as we speak. It doesn't look as strong as the others above it, but its the last one we've got, and if that fails we're looking at 1000 sats, back to its original sideways movement, worst case sceanario.
I believe its important to to consider every possibility. I predict that we won't break the support because alts are currently bleeding right now while bitcoin is currently having its spotlight moment at 6100 USD. BTC will eventually need to retrace down a bit, thus giving alts time to catch up again, in theory.
2. Falling Wedge
The support line isn't the only evidence to suggest we're bullish, we also have our 2nd indicator, the falling wedge. The falling wedge looks like its almost at the finish line, you can see its building up toward a bullish move.
3. RSI
Up next, we have the most important thing of all, the oversold RSI at level 19. This chart is on the 4 hour so you can clearly see its been like this for a while, the volume is telling us that its seriously oversold, which never stays there for long, or shouldn't at least.
When something is oversold, it quickly retraces back into to its comfort zone, which is at levels 30 to 70. At any moment, you can definitely expect a huge pump going vertically within a short span of time.
4. Risk Management
Last but not least, we have our risk/reward management analysis tool. Risk management is above all else. We're looking at a 4.47-1 trade, you have to ask yourself, how much can it dip?
We're almost touching the bottom at 1000 sats, there's really not much to lose, which is why the odds are in our favour, if you can find trades like that everyday, you'll be a billionaire.
In conclusion, I personally think we're going to hold the support, and then climb its way back up over time, whether it reaches the resistance or not its still a good entry regardless, and that's the key of being a good trader, your wins and profits come from good entries, otherwise you're doing it wrong.
Thank for your time ladies and gentlemen. Let me know what you guys think in the comments. Feel free to use my posts as an indicator for confirmation, or something you can use as a reference to your trades.
Twitter: @cyber_stocks
Discord: CyberStocks#9378
Feel free to support me, any help is appreciated. All funds will directly support my personal struggles, and most importantly, my mission of building an online brand :)
BTC Donations: 1AuZiofHSqM5gV1ttxUddNovDhEtHgMUgA


ENJBTCPara ingresar esperar la formacion de figura de cambio de tendencia en 4H o 1D , con incremento de volumen.
"La paciencia paga"
"La estadistica es tu amiga"

ENJBTC another profit opportunity up-to 282%The ENJBTC has retraced to make another harmonic and entered in potential reversal zone insha Allah.
The targets are:
Buy between: 0.00002566 to 0.00001527
Sell between: 0.00003385 to 0.00005837
Regards,
Atif Akbar (moon333)


ENJ/BTC Bullish DivergenceSeeing bullish divergence on the 1hr chart
Entered into a small position
Mainly doing this to keep a record of my trades but if you think my charts are getting better lemmie get a like lol

ENJIN AND THE CORRECTION Talking about Enjin coin i can conclude if the price breakdown the 0.0002539 Then price is likely heading down a bit further as the 5th wave should start developing south approximately between 0.0002050 and 0.0001800 ish areas
whats my suggestion ?
buying now is possible with a stop below 0.0002539 as we spoke if it broke then we will be confirming the wave 5
this coin has a potential to grow fast this year keep an eye and think to invest wisely .. laddering from 2000 to 1800 ish areas is logic if it break the current bottom at 2539
breaking the key support of 0.0001500 ish areas will be considered a stop loss area as i believe it will dump fast there if broke
Good luck

ENJBTCLooking at ENJ on the daily chart
* Hitting location on the .618 fib
* Nice double bottom
* OBV showing a bullish div
* Histogram showing a bullish div
* Willy showing a bullish div
* Low volume, so I would like to see the bulls step up and take control
* Still a big notch in VPVR that needs filling in at some stage.
I've all this is a very bullish chart and I like what I see
* Don't forget to hit that like button and follow me on Trading View and Twitter for more chart analysis :)


ENJ / BTC will need some time! Still can do 170% EOY 2019! ENJ/BTC had a heavy pump during the past weeks,
even tough it has corrected about 50% now.
It has come to a very strong support zone (previous high), which is a good point to buy.
Nevertheless the MACD shows some signs of weakness, so you should have stops in place.
The most likely way will be a slowly but steady uptrend to 8000 satoshi end of year 2019.
Trade it now on binance: binance.com/?ref=28929579

ENJ / BTCWatching for any sign of a bounce off of .786 Alert set
Very much dependant on BTC behavior and developments in the Tether / Bitfinex event.

ENJ/BTC Update - What happened?I think ENJ needs some serious down time. The small break out from the wedge was organic, then BTC decided to wake up. Same as the missing Wave 3 when BNB FOMO kicked in the market dumped their ENJ Holdings. I did however get reports of large purchases of ENJ today so I guess we will have to wait and see. AND PLEASE people, head and shoulders is a bearish warning signal for a down trend to follow!!!! Inverted H&D is bullish!! anyway, two bullish signals but no breakouts.. Is ENJ accumulating breakout energy?


Head & Shoulders possible formationThere seems to be a Head & Shoulder forming.
Confirmation if we see green on the next couple of candles.
BINANCE:ENJBTC

Scalping ENJ (looking for around 30%)ENJ BINANCE:ENJBTC has had all the hype with the confirmed samsung wallet a few weeks ago. Now I would like to see a run up to 4500 area. Stop at 3100-3200. If this level is broken, i’m not interested in buying back until around 2200.

ENJ/BTC | 12hr | Heiken Ashi candles | 33%-71% profit potential Hey Traders!
Here's what I see for ENJ/BTC pair on the 12hr chart. Lets read the chart from top to bottom.
1. Heikin Ashi Candles: Trend is showing 6 Green bullish candles at the moment.
2. Support/Resistance: Drew 1 strong support line which is obvious. I drew 3 resistance lines that I will use as sell targets.
3. Moving Averages(MA): My Moving averages match Binance. That is 7(yellow), 25(blue), 99(purple). ENJ broke up through the blue MA and now ENJ needs to break the 99(Purple) moving average and we will be moving up big time in profits but bloody Monday is coming and we all know what happens there. I see a slight rejection happening right now for a few days.
4. Volume: Volume is green still and near the Moving Average.
5. Stoch RSI: Over Bought. Simple explanation here. Overbought means the price will go down.
6. MACD: Still looking bullish as the green line is staying above the yellow and the Histogram(Tick marks) are ascending. Everything is still green.
All in all, I think ENJ will move up to those sell target but will have to fight to break through all those previous rejections, 99 MA, & bloody Monday. This is a mid range trade.
As a short term trader, I will take those 2 first targets at 4921(Target 1) and 5645(Target 2) but won't stick around for the last target around 6391. I'm too impatient to hold a position too high.
Thank you.

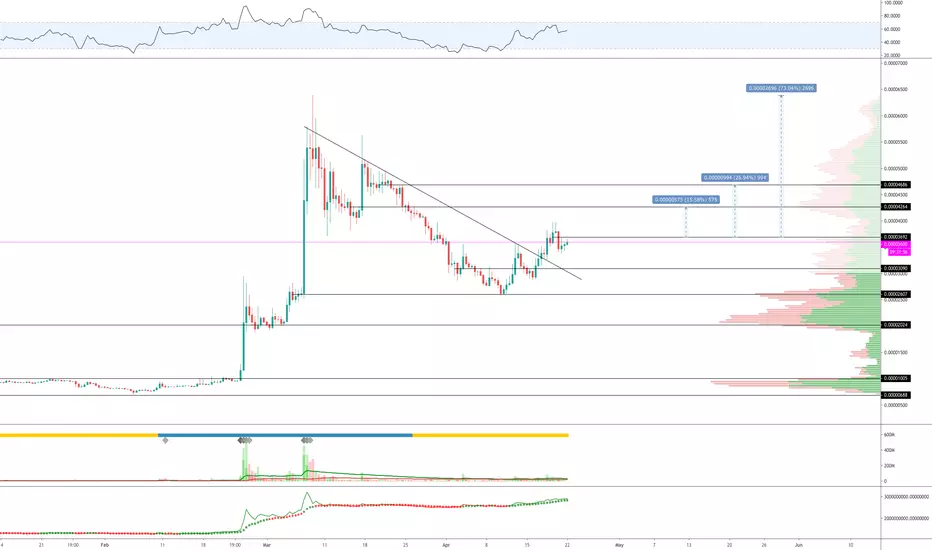
ENJ getting ready for test of ATHENJ has broken above the falling wedge and is testing supply right now
Has been consolidating under resistance for a little while now and a break could lead to some momentum to the upside
Retest of all-time highs is very possible if BTC continues to range for the rest of the week(s)
Thanks guys!