ENJUSDJust a quick heads up on ENJUSD. We recently hit short term lows and are now rebounding. This is something we can observe a lot of the time, and usually brings a good buy opportunity. This is not financial advice.
ENJUSD trade ideas

ENJ/USDTrendline breack with rejection of the 21 smoothed moving average
Rsi above 50 line
TTM is heading to the green

Enjin - ENJUSD - BullishENJUSD CMP - $3.30
Looking bullish in higher time frame. One can go for Positional Trade Setup with the following entry, exit & targets.
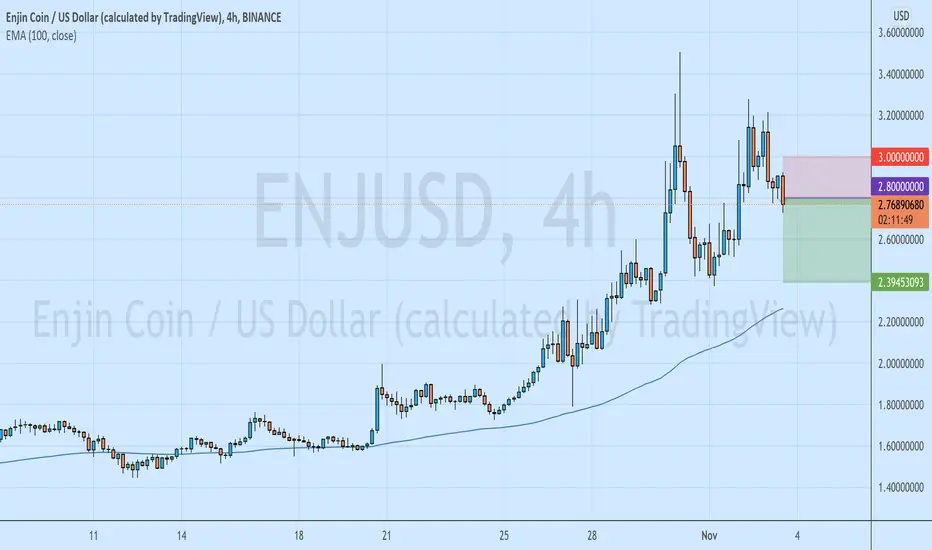
Buy Range $3 - $3.30 / Stop Loss $2.25
Target 1 - $4.20
Target 2 - $4.75
Target 3 - $5.30
Disclaimer: This is my view and for educational purpose only.

ENJ/USD Rejected off 21 smoothed moving average with engulfing candle
Rsi above 50
TTM in the minor green

MY MINIMALIST ANALYSIS FOR ENJIN$ENJ
ADJUSTED TARGET AREA OF VALUE ON THE CHART
11.06.21
1813H +8 SINGAPORE
Disclaimer:
The findings of the following analysis are the sole opinions of the publisher of this idea and should not be taken as a piece of investment advice.
ALERT:
COMING UP TO OUR TARGET EXITS
The Market has amazingly moved along the TOPS and BOTTOMS of our BOXES, signifying TURNING POINTS of PRICE ACTION.
DO NOT FORGET TO SHAVE-OFF PROFITS if you wish to maximize or want to go BEYOND PARABOLIC. WATCH PRICE ACTION CLOSELY and
ADVANCED CONGRATULATIONS TO ALL!
Happy Trading!
REMINDER:
INDICATED ARE ENTRIES, PARTIAL EXITS/TOP-UPS, EXITS, and MAXIMIZED AREAS OF VALUE
"FOLLOW THE WHITE RABBIT!"
Just Follow the TOPS and BOTTOMS of the BOXES as a GUIDE where the MARKET will take you.
HOW TO USE THIS MINIMALIST CHART
Created on a MONTHLY, WEEKLY & DAILY Analysis (The Dynamics of the Market.)
It is designed for SWING TRADES at the BOTTOM. I do not SHORT, though, you can still use it.
You can CLICK AND hold THE CHART and PAN or DRAG IT.
TARGET ZONE IDENTIFICATION
The LARGE BOXES (Tops and Bottoms) are MAJOR pivot points that will occur sometime in the future. While the SMALL BOXES (Tops and Bottoms) are MINOR pivot points.
These can be entries to a BUY/ SELL POSITION, EXIT/PARTIAL EXIT/TOP-UP AREAS,
and, if you wish to hold longer for a MAXIMUM TARGET EXIT AREA OF VALUE - CONSERVATIVE (If price action conditions are right at that given moment.)
At times I include WAY BEYOND PARABOLIC Price TARGETS depending on The Character of the Market (CRYPTOS ONLY).
Watch out for your Volume, Chart Patterns, Candlestick Math, FIB COILS ( ABC ), Price Action, FIB LEVELS, Market Dynamics, especially institutional and retailer trading psychology.
Wishing you all The Best Trades and Thank you all for your Appreciation and Support of My Work.
Much thanks to My 3 Mentors. They are so much of a Blessing that I also wish to Share.
Vive Le Autist!

ENJ - Looking GoodThis one sure likes to run and retrace, right now its appears to be running. Everything metaverse is pumping and this has good technicals. I am hoping that if BTC stays bullish this will pull through to higher prices. NFA DYOR

Enjin Coin, Went the same way as i said 25% upEnjin voin has finally given a breakout and shoot upto 25% in just one big bullish candle

ENJUSD sell ideaquick scalp on the short side, i see a double top on the technical chart so taking a stab at it 🤪
ENJUSD D2: +300% gains BULLS THE BEST level TO BUY/HOLD(SL/TP)(NWhy get subbed to me on Tradingview?
-TOP author on TradingView
-2000+ ideas published
-15+ years experience in markets
-Professional chart break downs
-Supply/Demand Zones
-TD9 counts / combo review
-Key S/R levels
-No junk on my charts
-Frequent updates
-Covering FX/crypto/US stocks
-before/after analysis
-24/7 uptime so constant updates
🎁Please hit the like button and
🎁Leave a comment to support our team!
ENJUSD D2: +300% gains BULLS THE BEST level TO BUY/HOLD(SL/TP)(NEW)
IMPORTANT NOTE: speculative setup. do your own
due dill. use STOP LOSS. don't overleverage.
READ ENTIRE IDEA BEFORE EXECUTION!
🔸 Summary and potential trade setup
::: ENJUSD D2/candle chart review
::: corrective cycle in progress no
::: spec C&H setup in progress / buy low
::: same structure MAY repeat soon
::: setup still valid as of RIGHT NOW
::: chart is LOG SCALE
::: get ready to BUY LOW later
::: currently/soon CORRECTION MODE
::: BUY LOW after 30% correction
::: entry - late Nov 2021
::: for now PULLBACK/CORRECTION MODE
::: on the right same a/b/c/d/e fractal
::: 2017/2018 fractal from the past
::: resulted in 300% gains off the ow
::: re-test of range lows is likely
::: point d is BEAR TRAP (fake breakdown)
::: SPECULATIVE SETUP
::: do your own due dill
::: and use proper risk management
::: TP bulls is +300% gains
::: details: see chart
::: FINAL TP is +300% gains
::: recommended strategy: BUY/HOLD after correction
::: TP BULLS +300% gains
::: SWING TRADE: BUY/HOLD IT
::: bull run not over yet
::: good luck traders!
::: BUY/HOLD and get paid. period.
🔸 Supply/Demand Zones
::: N/A
::: N/A
🔸 Other noteworthy technicals/fundies
::: TD9 /Combo update: N/A
::: Sentiment mid-term: BULLS/300% gains
::: Sentiment short-term: CORRECTION/MODE
RISK DISCLAIMER:
Trading Crypto, Futures , Forex, CFDs and Stocks involves a risk of loss.
Please consider carefully if such trading is appropriate for you.
Past performance is not indicative of future results.
Always limit your leverage and use tight stop loss.

ENJIN (IM BULLY)This baby is in the right sector! Gaming Yes Gaming! She's going to keep running in my opnion. Trade well My friends!

ENJ/USD 50% returns in coming weekENJ/USD has given a breakout from its consolidation, and also retested the level , now its ready to skyrocket, buy and hold tight to enjoy the ride

EZJ coin buy or sell call.EZJ coin big pump (news) coming soon get ready for that!
Buy on red line points ❤
Sell on green line points 💚

MY NOT O MINIMALIST ANALYSIS FOR ENJIN$ENJ
10.27.21
1147H +8 SINGAPORE
ALERT: ENTRIES, PARTIAL EXITS, EXITS, and MAXIMIZED AREAS OF VALUE
Disclaimer:
The findings of the following analysis are the sole opinions of the publisher of this idea and should not be taken as a piece of investment advice.
"FOLLOW THE WHITE RABBIT!"
HOW TO USE THIS MINIMALIST CHART
Created on a MONTHLY, WEEKLY & DAILY Analysis (The Dynamics of the Market.)
It is designed for SWING TRADES at the BOTTOM. I do not SHORT, though, you can still use it.
The LARGE BOXES (Tops and Bottoms) are MAJOR pivot points that will occur, while the SMALL BOXES (Tops and Bottoms) are MINOR pivot points.
These can be entries to a BUY/ SELL POSITION, EXIT/PARTIAL EXIT/TOP-UP AREAS and even if you wish to hold longer for a CONSERVATIVE MAXIMUM TARGET AREA OF VALUE (Depending on, if the conditions are right.)
At times I include WAY BEYOND PARABOLIC Price TARGETS.
Watch out for your Volume, Chart Patterns, Candlestick Math, Price Action, and especially your Fibs, Market Dynamics, and trading psychology.
The above-mentioned is sufficient enough as a major deciding factor for this MINIMALIST CHART.
Note: That This CHART is best used without indicators. (As we all know, they lag.)

ENJUSD COINBASE BREAKOUTJust a quick show as Enjin just broke out of it's channel. Will it retest the top of the channel before blasting off?... stay tuned...

ENJ as crypto gaming token could take off to past $4I'm playing ENJ short term as a quick trade. Grabbed some in the retracement and with this volume activity took already my 1/3 profit. Looking above here to take a second tier profit and final take profit if it gets above 4. I think it can continue higher but I'm being conservative here.

BULLISH - ENJDidn't see this until now but its just breaking out of this symmetrical triangle to 4.60. The breakout just occurred so its possible we get a correction to 2-2.20 here before continuing to 4.60 but it looks great.

ENJIN is about to takeoffENJUSD has broken out of this triangle that has formed
It could also be considered a Flag, as part of a bullflag structure
You can see the price creeping out of the triangle, a very bullish scenario
Don't miss this one

ENJUSD Price AnalysisThe daily chart shows ENJ cleared trend resistance at $1.7800 on the 20th. Furthermore, the price pulled back and bounced from trend support after breaking out, reinforcing its validity. After successfully retesting the trend, Ejin surged above the September high of $2.3325, now the first support. Below $2.3325, the 20, 50, 100, and 200-DMA’s join the trend (now at $1.6600) to create significant confluent support.
However, the Relative Strength Index (RSI) reading of 78.05 tells us the rally is overdone in the near term. On the other hand, cryptocurrencies have a habit of over-extending for long periods before correcting. Nonetheless, the elevated RSI reading could be significant. If Enjin coin retraces below $2.3325, it could trigger a reversal, targeting the trend support. But for now, the likeliest scenario is a squeeze higher, which in my opinion, will ultimately prove unsustainable. However, as long as ENJ holds $2.3325, it will likely go higher, but a close below $2.3325 could derail the immediate bullish outlook.
Hello community, please if you like my ideas do not forget to support them with your likes and comment, and you can also get in touch for daily signals and alerts

NFT SpeculationIs ENJUSD a good buy? I've heard everything about this coin that it's supposed to do so many different things. I've been looking at this patter for a couple of days. Again just like BTC had there are "Four Soldiers" marching up & it may go higher. Lots of short term selling rn but it's been steadily gaining. Any ideas?

ENJIN COIN - Long Term Out Look GreatENJ seems to have a great use case for the gaming industry and technically we seem poised for higher prices. An extrapolated move out of the triangle could yield 120-150% gains over the coming weeks. Pure speculation. NFA, DYOR.

ENJIN has bounced off the new floor at $1.70!!BINANCE:ENJUSD
ENJIN Coin soared up 1735% from Nov 2020 to April 2021 hitting an all time high of $4.03.
Measured move based off neckline to swing low of cup with handle is $4.72 The Measured move based on the bull pole bull flag of 1735% is $32.00

short from here.I'v been waiting for the trend line to be broken to go short. Please like this my TA and comment your thought in the comment section.

ENJ WHAT TO EXPECT$marsh analysis
Pushing short term down into demand zone as BTCDOM rises
Look for the entry with tight SL in demand zone or enter on SR/flip upon break of the downward resistance
