🕹️ ENJIN - Breakout Can Continue 🍊ENJIN is a project we like a lot.
The market has taken a huge beating but some Teams seem to be working endlessly and this can reult in profits in the future. ENJIN is one of them.
NEWS:
Enjin to Launch a Beta Tester Program for Enjin Wallet 2.0 :
Developers from Enjin, a company that provides an ecosystem of interconnected, blockchain-based gaming products, have been developing a new version of the Enijn wallet, known as Enjin Wallet 2.0. Now, it appears that the wallet is approaching its launch, but before the team can release it, it first needs to put it through a beta tester program.
According to their recent announcement, the team is looking for experts who would join the tester program to check out the wallet, report on potential flaws, and generally help make the product better by providing feedback based on its current performance.
What is new in Enjin Wallet 2.0?
According to the team, the new wallet will offer a number of exciting new features. Not only that but it will be supported by top blockchains and NFTs. Some of the new features that testers and later users can expect include multi-chain support, dark mode, as well as a brand new dApp browser.
The team also stressed that these are only the features that will be available initially, right after the full launch. In time, they also plan to introduce a number of new things, although they did not specify which ones or when.
As for the supported blockchains that the wallet will support, those will include Bitcoin, Ethereum, Enjin, Litecoin, Dogecoin, Binance, Polkadot, Kusama, Acala, and Karura.
Apart from the mentioned features, Enjin Wallet 2.0 is also expected to come with some advanced improvements and features, such as the fingerprint scanner for greater security; custom fees and limits, import and sweep feature, auto-add tokens feature, support for over 25 languages, as well as the local currency where users can view the balance in their native currency, for an easier funds management.
Also: How Will Xchange Monster (MXCH) Impact The Gamefi Industry Along with Enjin (ENJ)?
Xchange Monster ( MXCH) is a fully-regulated platform by FINMA, one of the most recognised regulators in Switzerland.
One Love,
the FXPROFESSOR
ENJUSDT trade ideas

enj position takendouble confirmed buy signal for quick scalp. flashed green avove white line on oscilator and also lux algo premium buy signal

Luck or Chart?ENJIN , SANDBOX and MATIC where in the 3 Top gainers in the Top-100 today.
Last night we posted Long signals on these 3:
Luck or Chart?
The Lucky Professor 🤞😺

ENJ/USDT: Key support tested - Direct rise expected---- Mid-term Analysis for the next coming 4 weeks to 3 months - Daily on Daily Chart (LOG)-------
ENJ/USDT: Key support tested - Direct rise expected
Context
- The Global Crypto market leads by BTC and ETH is still evolving within a bearish market configuration. Like the others digital assets ENJ suffered about negative global market situation.
- However we are focus on a direct rise now on this coin and we expect a fast and quick recovery regarding technical elements provided by the interpretation of the Elliott waves and bullish divergence on RSI
Market configuration
- Graphical Elements :
Graphical Resistance = 1,37 & 4,00
Graphical Support = 0,38 & 0,22
- Mathematical Indicators:
EMA ( Exp Moving averages) are still capping the market at 0,74 = Bearish
RSI indicator (below) is bouncing off key support with divergence = Bullish
- Elliot & Harmonic Wave (Fibonacci):
Fibonacci Target C (B) has been already reached = 0,38
Fibonacci resistance of the wave in progress = 0,74
Fibonacci support of the wave (c) (B) (max extension) = 0,22
Fibonacci Bullish Target = 1,37
Conclusion
Preferred case => Regarding the mid-term element, ENJ is offering the perfect entry area for DCA or short-term recovery as long as 0,38 remains a support area valid, a break above 0,74 will confirm a rise to 1,37
Alternative cae => breaking below 0,38 - direct drop to 0,22

ENJIN - Time for a Proper Rebound?Could be.
Professor is Bullish at the moment but with care.
Check our other posts today for more info:
FEDS have spoken and our sentiment is that a rebound could now continue.
Powell mentioned recession a bit more than i expected but the statement is more Dovish and i hope that the markets can see this in a positive way.
I am going Long with care and ENJIN is one of the assets I like to Buy.
One Love,
the FXPROFESSOR

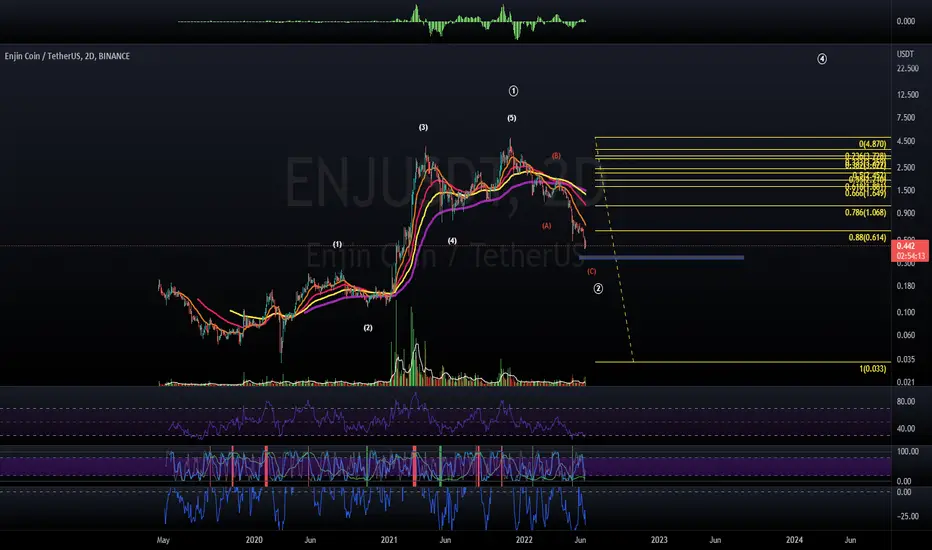
$ENJ (log chart) - Not quite there. There's a case for the move down being done (ABC classic ZigZag ).
But I dont like that fact that the 2D RSI here isn't above the 30 mark on its divergence. Which leads me to believe we could see one more bout of downside to finish off this correction.
The coin is making nice waves tho and I have good hopes to see it at ATH before long.
Happy trades to all.
ENJ can Go Bullish Or Bearish!what can expect in Both SituationsENJ is in a Symmetrical Triangle and Haven't done a Break out Yet! So We can Not Determine Whether It's gonna be bearish or Bullish We Have to wait and see what will happen. in Bullish case The Price will Reach 1$ Which is also a Strong Resistance as well! In Bearish Case The Price will Reach 0.5$ which is also a Strong Support For ENJ ! The Expected Movement will be Confirmed In a Few Days!
-ENJ is in a Symmetrical Triangle
-No break out yet
-Bearish Case :0.5$
-Bullish Case:1$
-Trend will be Determined In a Few days!
_ _ _ _ _ _ _ _ _ _ _ _ _ _ _ _ _ _ _ _ _ _ _ _ _ _ _ _ _ _ _ _ _
Thank you for seeing idea .
Have a nice day and Good luck


ENJ/USDT BUYING SETUPENJ rejection after hit resistance bullish flag trendline , and also any inverted head and shoulders pattern now correction to make right shoulders IHNS will valid if rejection not breakdown the support
potential breakout and continue upward movement
Buy zone : 0.635 - 0.585 - 0.5
Target : 0.7 - 0.744 - 0.784 - 0.837 - 0.904
Stop : 0.47

ENJIN COIN - bullishPrice should break to the upside.
I compare the next move to the similar pump of 60%
Assuming the correction is completed, as an ABC, with a triangle in wave B. In this case price action confirms the next move up.
Trade safe

ENJEnjin Coin provided limited pulsations in order to shape a kind of support region. In addition to the price movement we can also observe tendency of ENJ to reach resistance levels mentioned in the analysis.

Enjin Coin (ENJ) - June 1hello?
Traders, welcome.
By "following", you can always get new information quickly.
Please also click "Like".
Have a good day.
-------------------------------------
(ENJUSDT 1W chart)
Below 0.563 is likely a long-term investment area, so you need to trade cautiously.
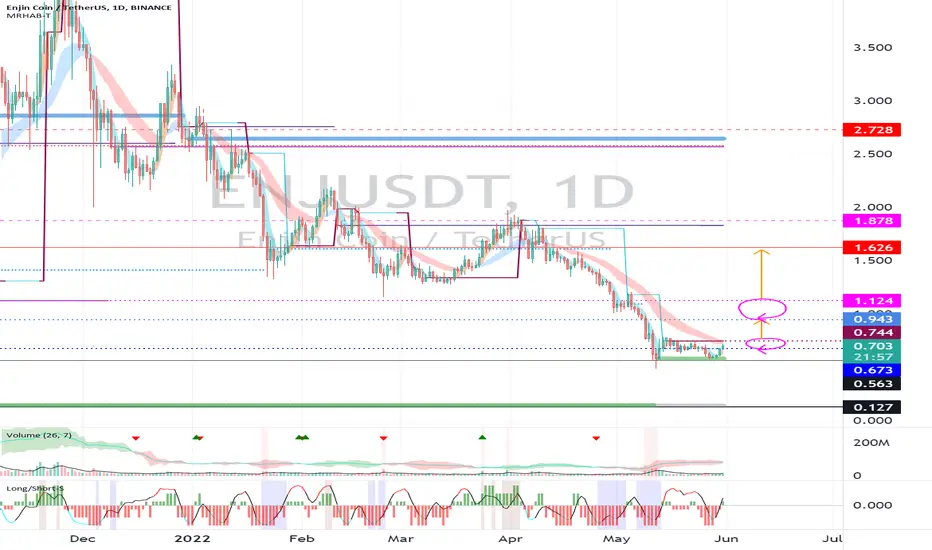
(1D chart)
In the short-term and medium-term perspective, it needs to move above 0.744 for support to turn into an uptrend.
Accordingly, it is an important issue whether it is supported over the 0.673-0.744 range.
(buying)
- After confirming the support at 0.744
(Stop Loss)
- When the resistance falls below 0.673
- When it falls below 0.563
(Sell)
- When resistance is received in the 0.943-1.124 section
- When receiving resistance in the 1.626-1.878 section
------------------------------------------------------------ -----------------------------------------------------
** All indicators are lagging indicators.
Therefore, it is important to be aware that the indicator will move accordingly as price and volume move.
However, for the sake of convenience, we are talking in reverse for the interpretation of the indicator.
** The MRHAB-T indicator used in the chart is an indicator of our channel that has not been released yet.
** The OBV indicator was re-created by applying a formula to the DepthHouse Trading indicator, an indicator disclosed by oh92. (Thanks for this.)
** Support or resistance is based on the closing price of the 1D chart.
** All descriptions are for reference only and do not guarantee a profit or loss in investment.
(Short-term Stop Loss can be said to be a point where profit and loss can be preserved or additional entry can be made through split trading. It is a short-term investment perspective.)
---------------------------------
Cup and handleCup and handle may work and we will see a downtrend, although an uptrend is likely to occur, but we will have a strategy for both scenarios, please stop loss in all positions, thanks


ENJIN In Next Day's Potential to Rise>>>>>>>>>>Hello EveryOne
I Have Tried My Best to Bring the best Possible outcome in this Chart.
By temporary sales pressure decreases,
We have a short-term trading opportunity setup.
All possibility TP's marked on the chart.
PLZ set SL.
This is not financial advise.
PLZ DYOR.
With hopping success>>>>>>>>>>>>>>

ENJUSDT Long Setup!ENJUSDT Technical analysis update
ENJUSDT currently trading at $0.69
Buy level: Above $0.725 (only buy after the price breakout)
Stop loss: we will update once we see the breakout
Resistance 1 : $0.78
Resistance 2 : $0.86
Resistance 3 : $0.92
Resistance 4 : $1.00
Always keep stop loss.
Thanks
Hexa


ENJ/USDTENJ / USDT
It is in a trading area that has lost its support.
On the other hand, it broke its uptrend line downwards.
We expect the $ 0.57, $ 0.53 and $ 0.485 to fall.
#ENJUSDT #BTCUSD #ETHUSD #LUNABUSD #LUNAUSDT

BUYING ENJ/USDT (SWING)$ENJ has hit support and make a strong rejection , Consolidation movement we can swing in this situation .
in lower time frame potential make a IHNS pattern
Indicator like RSI and stochastic showing oversold , we can setup entry
Buy zone : 0.666 - 0.646 - 0.625
Target : 0.695 - 0.712 - 0.742 - 0.774 - 0.876
Stop : 0.6

ENJUSDT levels of support and resistanceDuring the conduct of your analysis it is imperative that you remain aware of the whole area, even though your chart may show support and resistance represented by a single line. Be aware that the price may turn before the line; and that a break of that line does NOT necessarily constitute a break of the support and resistance level.
*Notice, that the violet zone is the price level where the most amount of volume was traded.

#ENJUSDT 2H Chart
Price is currently ranging slowly but steadily in an uptrend after tapping into the 2h demand zone. MACD is not clear, RSI and EMAs are both neutral. Price may still move down in order to fill the FVG (fair value gap) and tap into the next major 4h demand at $0.59 before moving up again to take out all the liquidity resting above both levels of equal highs.

#ENJUSDT 4H Chart
Price previously bounced from the 12h demand zone and left another major 4h demand zone between $0.55 and $0.59 with a FVG (fair value gap) between $0.6 and $0.645. MACD is not showing clear indications, RSI and EMAs are neutral. Price formed a major level of equal highs where we have lots of liquidity resting above it and overall i expect price to fill the FVG and tap into the 4h demand before continuing to move up.

ENJIN COIN WARMING UP ITS ENGINESGood morning all
We will be looking at the ENJ/USDT pair this time around
Lets begin!
In our previious analysis we pointed out regions where price could bottom out for enjin coin, as shown below;
Price is trading at that level currently and we have ourselves a Regular flat correction in play judging by the price action.
In theory a regular flat has it's C wave to be 61.8%, 100%, or 123.6% of wave AB. So far we have a 100% retracement leaving us with our worst case scenario zone aligned with the 123.6% fib support level. That said, this is a very good buying opportunity (don't take my word for it)
Our targets for the 5th wave fall within the $12-$15 dollar range depending on where the bottom will be.
Past analysis linked below
PLEASE APPLY PROPER RISK MANAGEMENT!
If you agree with the idea, pls like, share, and comment your thoughts below.
As always, feedback is appreciated!
