Potential Cup with handle ENJWe might have a potential CwH on Enj, zooming to 2h makes it bit more obvious and clear.
Fibs do the rest. Let's see how this one plays out in the next few days!
No financial adivce
First Target @ 4 Dollar (ATH) and rest at Fibs 1.618!
Good luck :)
ENJUSDT trade ideas

Short term ascending patternThe price of Enjin broke out and is building up above support for more upside. The long term volume development is fantastic. The next move could reach $ 7.50 - 11, even this year. Short term it's probably going to be tricky and choppy.


ENJ LIMIT ORDERS! MASSIVE PROFITS POTENTIAL IF ORDERS HIT$ENJ is one of my favorite meta coin and I would look into buying opportunities. One opportunity is right in front of me, if it hits my limit orders I'll be as much as I can.
However, there's no guarantee that the limits will be filled so DYOR!
Will only set limit orders and will alert you big time before a huge pump.
Limit Entry: $2.3 - $2
Current ENJ Price: $2.973

ENJ phase 1 to phase 2 P&F Point and figure projections phase 2 6.9$ Wyckoff Count Guide - continued


ENJ (USDT)ENJ (USDT)
take your profit at target number 1 and number 2
and for incase set your stop loss at 2.67
don't be greedy ..................


🕹️ ENJIN = Gaming Leader + NFT.io 🍊Enjin has been and will be one of our top-5 favorites.
The price can keep growing (we see a target of 7$ for the next 5 months).
What's new?
Well here you go, this is a message from my direct communication with Enjin:
'' It's currently not possible to launch a token using Enjin.
Although we'll be releasing the smart contract feature for our sidechain, JumpNet. You'll be able to program smart contracts and release your own tokens.
enjin.io
We're looking to release it around the end of this year or early next year.
As for an NFT marketplace, we'll be launching nft.io . You'll be able to set up your own marketplace. We're looking to launch it around the same time as the smart contact release''
Ladies and Gentlenmen,
Start your ENJines!
the FXPROFESSOR

Ascending Triangle After breaking over resistance, hit its head on fib extension at $3.20 multiple times then dipping to retest prior resistance as support... looks like an ascending triangle is forming.
Watch the 3.2 area to break and hold above.

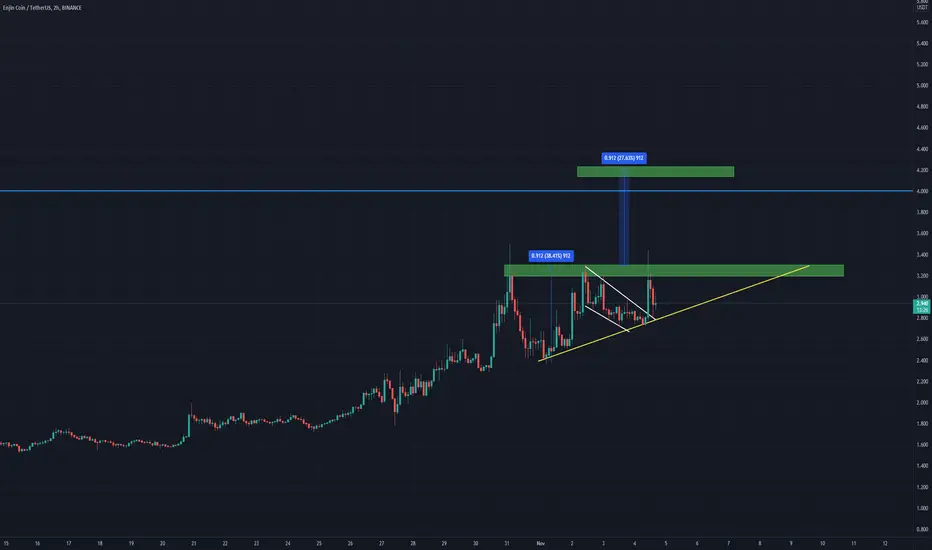
ENJ UpdateSo we had a strong breakout of the handle, nevertheless, the selloff was pretty strong either. An ascending triangle is forming, same target and same play. As long as we stay above the yellow uptrendline, this is fine. ENJ needs to break and hold 3.3 Dollar to see further uptrend to reach the 4.2ish!


ENJUSDTEnj shows inveted head and shoulders.
In the chart the resistance level and support appears.
So if enj succeed in break the neckline resistance, we may show profit until the next resistance.
This is just an idea.
Not financial advice.

ENJUSDTEnj in profit since breakout. From my previous chart.
This is just an idea.
Not financial advice.

ENJ gone in Parabola is she correcting?ENJ is a Metaverse coin she is gone in parabola and then... this is not financial advice...

ENJIN NFT coin will grow after bouncing from 61% fib levelENJIN NFT coin is in the potential state to grow high up. It will grow after bouncing from 61% fib level and initially hit 161% fib level as 3X growth target. we will update further about trade with time to time.
Don't forget to show your love by subs and commenting if you like this idea. I love to see your comments and thoughts.

ENJ/USDTesting/tracking elliot wave theory. Please do not trade off idea without S/L. Not financial advice.

ENJ USDT Long IdeaENJ broke out of resistance
Waiting for a dip to my buying Zone
Price making higher lows since May dip
Expecting fireworks soon

Will Enjin be next?It looks like Enjin is lagging compared to other metaverse coins like Decentraland (MANAUSD) and The Sandbox (SANDUSD). Curious to see if Enjin is able to keep up. Also Decentraland might have some more upside potential looking at the bullish rally of SAND.
