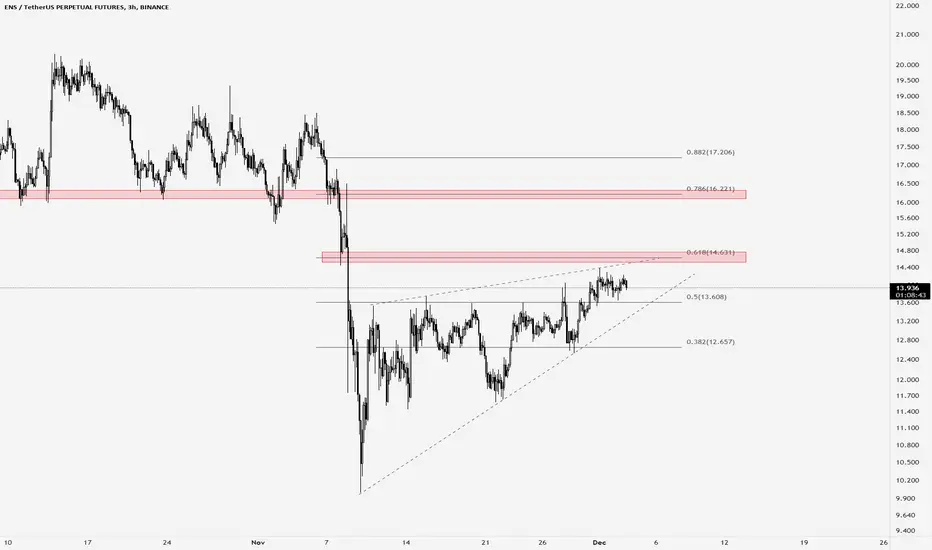
ENSUSDTThe price is forming a wedge pattern, after exiting the pattern, it should return to the upward trend line so that I can get a reliable trigger for a short sell position.
ENSUSDT trade ideas

ENSUSDT wants the Daily support?The price is testing the 0.382 Fibonacci level as new resistance.
We could see a spike until the 0.618 Fibonacci level
How to approach it?
IF the price is going to lose the support and retest it as new resistance, According to Plancton's strategy , we can set a nice order
–––––
Keep in mind.
🟣 Purple structure -> Monthly structure.
🔴 Red structure -> Weekly structure.
🔵 Blue structure -> Daily structure.
🟡 Yellow structure -> 4h structure.
⚫️ black structure -> <= 1h structure.
–––––
Follow the Shrimp 🦐

ENS USDT | everything is possible!Despite the bear market that struck most cryptocurrencies in Q3, ENS managed to keep generating revenue. While witnessing growth in terms of its network and daily activity, the future outlook for ENS seems positive.
ENS is trading at $13.13 and it had appreciated by 8.36% over the past seven days. However, in the past 24 hours, its volume depreciated by 6.47%. At press time ENS had captured 0.03% of the total crypto market.
ENS technically is above a very important support between 13 to 12.5 and breaking this support in daily or weekly time frames will open the road to 8.5 and 7.37 supports (decline by -30% to -40%)
We may open a very discreet trade according to the current support.
#ENS/USDT
🟢Entry price: 13.15 to 12.5
🎯Targets:
|> 14.17(Sell 40%)
|> 14.95 (Sell 30%)
|> 18.73 (Sell 15%)
|> 22.75 (Sell 15%)
🔴Stop-loss: 11. 35 (1D or two 4h candles Close under it)
➡️Recommended risk: 0.25%
➡️Recommended Position Size : 4%
please note that due to the current market situation this trade signal is considered risky, so we must stick together to the stop lose and risk management strategy and not to gamble with our money.
stay safe and trade safe
thank you!

ENS long idea.Flip the resistance and long position can be opend target $17
Stoploss 12.2
No financial advice
Always do your own research.

ENS will find support lowerHi everyone!
Yesterday whales were dumping ENS on the ENSBTC pair. As you can see we are on top of the range and the price has been rejected multiple times from the top.
I'm expecting a drop followed by a rise from the last support.
Please let me know what you think about this idea!

Trading opportunity ENSUSDTBased on technical factors there is a Buy position in :
📊 ENSUSDT
🔵 Buy Now 13.82
🧯 Stop loss 12.30
🏹 Target 1 15.46
🏹 Target 2 18.15
🏹 Target 3 21.56
💸RISK : 1%
We hope it is profitable for you ❤️
Please support our activity with your likes👍 and comments📝

ENS/USDT might go for a turnoverHey,
Long time we haven't spoken about this coin so it is time to take a look again. And last time we had such a setup it ended up well (We had a turnover). So let's see will we reach any targets here or no.
If you like ideas provided by our team you can show us your support by liking and commenting.
Yours Sincerely,
Swallow Team 🔱
Disclamer:
We are not financial advisors. The content that we share on this website are for educational purposes and are our own personal opinions.

ENS / USDT Long TradeThe ABC zigzag usually reaches at least 100% extension, and I´m trading this one :)

Impulse level breakdown. Gathering of liquidityA strong local resistance level has formed on the instrument, behind which there are many stops of participants, as well as the formation has the form of an ascending triangle, which indicates the interest of buyers.
I will wait for the formation of consolidation and impulse breakdown of several percent with volumes in the tape.


ENS with a 2000% gain potential into 2025ENS has a potential to gain 2000% going into the 2025 alt season. We will watch this project into spring/summer 2023.

ENS / USDT Short TradeExpecting at least one more leg down. Will move SL to entry point if T1 is reached.

ENSUSDT | MULTIPLE RESISTANCEENUSDT has hit the horizontal resistance zone.
The price on upside will face falling resistance, MA100 and Horizontal resistance too. The price action took a beat from that resistance zone .
We are expecting a downfall of price from resistance zone towards it support zone . The bears will take control from resistance zone . While bulls will be only in party if price closed above falling resistance line.
Trade your levels accordingly.

ENSUSDT is creating the head and shouldersThe price created a head and shoulders on 20$ area where the market got new liquidity to create a bearish impulse until the daily dynamic support
How to approach it?
the price could have a pullback until the 17$ area and create a new bearish impulse according to Plancton's Rules
–––––
Follow the Shrimp 🦐
Keep in mind.
🟣 Purple structure -> Monthly structure.
🔴 Red structure -> Weekly structure.
🔵 Blue structure -> Daily structure.
🟡 Yellow structure -> 4h structure.
⚫️ Black structure -> <= 1h structure.
Follow the Shrimp 🦐

ensusdt vpvr + support levels ensusdt long scenario with takes below resistance levels
ensusdt long scenario with takes below resistance levels
ensusdt long scenario with takes below resistance levels
ensusdt long scenario with takes below resistance levels

$ENS/USDT 1D (#Bybit) Symmetrical triangle breakoutEthereum Name Service seems to be ready to go back up after regaining the descending Trend-Line.
ens.domains ens.mirror.xyz
Risk/Reward= 1:1.2 | 1:2.1 | 1:3
Expected Profit= +27.84% | +48.78% | +69.74%
Possible Loss= -23.27%
Fib. Retracement= 0.236 | 0.382 | 0.5
Margin Leverage= 1x
Estimated Gain-time= 2-3 months

ENSUSD SHORTPossible bearish movement of the pair. The price is currently in a trading zone with significant volume , with rejections at the top of the price right at the 55 period EMA , which is essential in my strategy for analysis of possible trend continuations. We also see significant development in the Squeeze momentum indicator and macd histogram monitors, with directionality changes to bearish confirmed. We see the attached ADX indicator entering below the 23 level line (0 point of the MACD histogram), indicating the weakness of the previous move higher as it bounced towards the 55 period EMA , to continue falling as the moves have indicated. previous; along with a possible sell signal pattern coming soon on the MACD lines. There could be a continuation of the downtrend.
If you are going to take my opinion into account, please respect the projection time, this is extremely important. If it is not fulfilled in the foreseen time and it makes a range, it will be better to close the operation in case it is possible.

ENSUSD - Curved Uptrend ContinuationENSUSD has allowed the bullish reversal along this curved trend line
This large curved trend line could initially be considered a descending scallop (looks like a lower case l from the initial price beginning) but now it has progressed to where the structure is enabling the bull market
Scenario where the curve continues and the bulls win.


Ethereum Name Service(ENS) formed Gartley for upto 14.50% moveHi dear friends, hope you are well and welcome to the new trade setup of Ethereum Name Service (ENS) US Dollar pair.
On a 4-hr time frame, ENS has formed a bullish Gartley pattern.
Note: Above idea is for educational purpose only. It is advised to diversify and strictly follow the stop loss, and don't get stuck with trade

ENS Long Setup2 week 21 ema and 1 tenkan currently rejecting price. Opened second monthly candle over the 10sma. Looking at the daily structure, seeing the bid zone around the top of the cloud between the 2 week 10sma (curving up) and the monthly 10sma. Been patiently waiting for this long as I believe it to be the long into the trend trade. Easy invalidation with close UNDER 2 week 10sma. Might start dca in around daily kijun as there is also weekly support in that zone.

ENS : 2 TREND TARGETSENS is one of the interesting coins for the coming time.
It seems that ENS can show some effects on the low time frame
ENS is known for the idea to make ETH addresses into short addresses so they can be linked to Twitter and other websites, further, they building on more trends.
There are 2 expected targets
21 USD
28USD
The reason for this adding is that there is a high chance this coin will move into the short term.
