ENSUSDT trade ideas

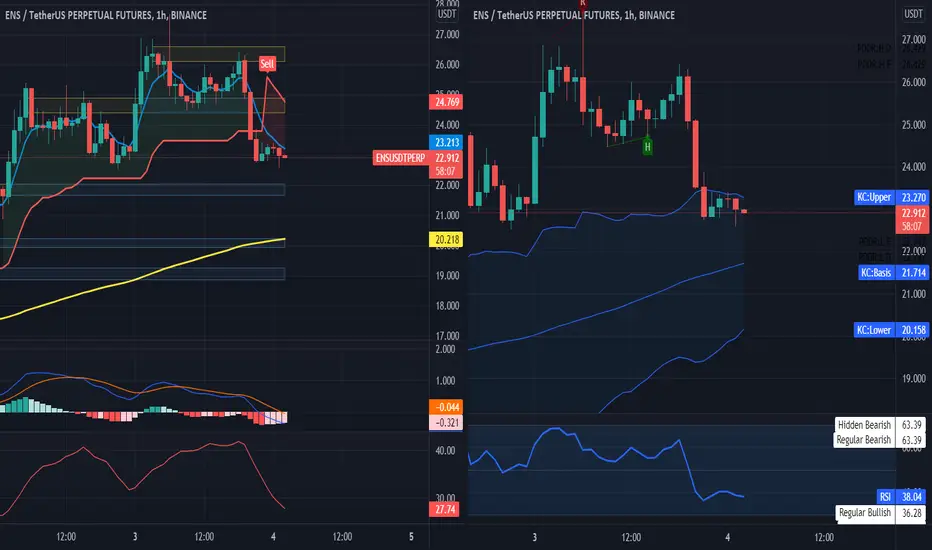
ENSUSDTPERP possible downward moveEntry : 17.5 - 18.0 - 20.0
SL : 21.0
Targets : 17 - 16 - 15 - 14
IMPORTANT : Do Proper Risk Management

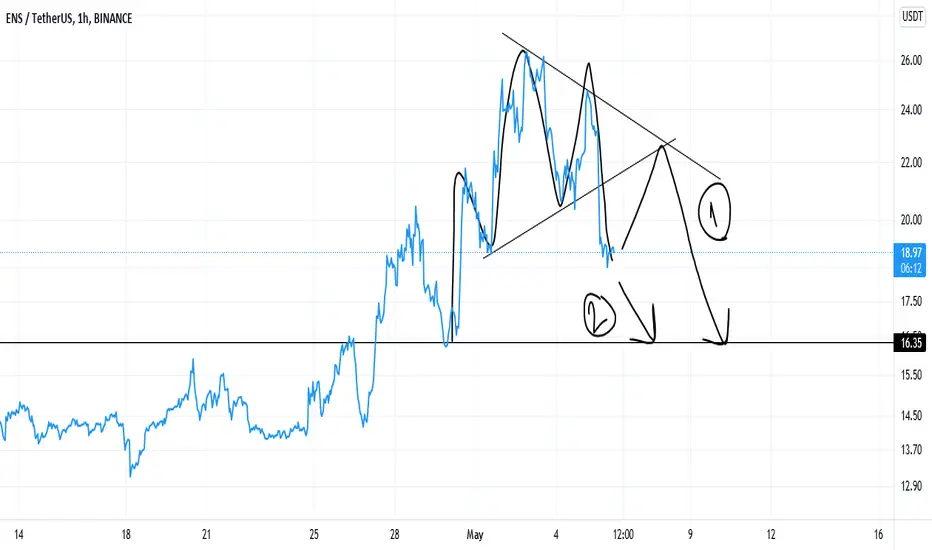
$ENS SHORT (DT) RISING WEDGE #ENS #CRYPTO Please remember to factor in if the trade posted is a DayTrade (DT) or SwingTrade (ST). To eliminate any confusion, all of the Title's should include one or both DT / ST.
PLEASE REMEMBER TO NEVER FOMO IN!
I'm here to share my thoughts and also receive feedback so please leave a comment if you agree/ disagree/ or just wanted to talk about a different setup.
Thanks,
QoverQ

Should we see a fall? Why? ENSUSDTThe full pattern is clear, the first target is in the range of 16, the probability of a return to the neckline is also high, it will be a little high in the whole market and will continue to fall.
ENSUSDT SOME BAD THEN SOME GOOD Looks like we may of broke the neckline for the head and shoulders pattern.
Figure we get a pull back, then continue it's upward momentum, unless BTC really craps the bed.
It could also bounce in the 17s but we will see.
Like comment and follow if you agree! Thanks.

ENS to $18Right time to short $ENS. It is currently doing an ABC and looks like A and B are complete. It should go down to $18


#ENSUSDT LONG >>>>>>>>>>>>>>ENS USDT
SUPPLYANDDEMAND
WAVES
ORDERBLOCKS
LIQUIDITY
RANGE
MARKET structure
BOS
trend
long
..........................


$ENS SHORTI've been shorting ENS since the break of $24. Hoping it continues the drop with minimal consolidation.
I could see it going as low as $16.50
"HOPE IS NOT A STRATEGY, TRADE WITH A PLAN!"

Ethereum Name ServiceEveryone's favorite Airdrop/DAO/NFT/Web3 functionality ENS has been catching a decent bid amid current market conditions.
Up about 90% from the lows while the majority of the market is back to their lows, I'd say ENS is doing pretty well.
From a point of value/ R:R, and also based on popularity, utility + sustainable future, ENS is in a great place currently at face value for a swing/mid-term hold (IMO).
Recent News
ENS 3 & 4 digit number names have become quite popular recently creating a buzz around the NFT ecosystem, most notably with BAYC/MAYC members buying the # that corresponds to their NFT #.
Adding to the above, with the new otherside deeds going live, ALL ENS numbers from 1-10k & 10.1 - 20k are taken. Quite an influx of cashflow is no doubt having an effect on the price of the underlying token as I believe a portion of the funds go towards the DAO and the community handles it from there, making for a fundamentally bullish case IMO.
I myself have been trying to snipe notable names that are expiring soon . Think of it like buying the copyright to your name - no one else can have the same name as you, and if they want to, then theyll have to pay you at your price. I believe ^this^ portion of the analysis is where the greatest value will come from; I'll leave you to connect the dots and figure out the rest.
ENS also recently broke the threshold of 1,000,000 names.
Moving along, looking at price as a whole, its evident to me that ENS has went thru a full market cycle and is in the last phase. Think of the famous Market Psychology Chart.
Many airdrop tokens & brand new low-midcap IDO tokens tend to go through this Market Psychology M as I like to call it at a much faster rate than more sustainable tokens. I believe I have a few analysis on that topic that I'll link below.
Conclusion
Looking at all the factors mentioned and from a probabilistic view:
Is it possible for ENS to make it back to $40 given there is a rise in popularity again?
YES
Is it possible due to the current market cycle phase for ENS to make it back to at least $40 without any other factors?
MAYBE
Can ENS fall back to lows where we see a fourth bottom and likely fall even further creating a much worse R:R ?
UNLIKELY (NO)
Based on current strength relative to the market, can ENS possibly continue even for a short while breaking the next resistance level?
YES
Welp, thats enough for me to look for an entry and potentially hop into the next trend. ENS names becoming hot again is definitely something I see happening; everyone already has their twitter usernames as their ENS, so what could really go wrong by buying a name you like, or even investing in the project that facilitates this?

ENS RETESTED THE ASCENDING TRIANGLE !!This will lead us to 32$ ( 1.27 FIBO )
please confirm if you agree


ENS USDT ShortRisk warning, disclaimer: the above is a personal market judgment based on published information and historical chart data on Tradingview, all analysis is only subjective. Hope investors consider, I am not responsible for your investment decision. Thank you.
Good luck!
ENSUSDT SHORTRisk warning, disclaimer: the above is a personal market judgment based on published information and historical chart data on Tradingview, all analysis is only subjective. Hope investors consider, I am not responsible for your investment decision. Thank you.
Good luck!


ENS: Follow The Trend !Ethereum Name Service turned bullish from minimal news: finance.yahoo.com
This shows ENS has a strong community and is a great long-term hold. I'm trying to hop on the train. ENS is a coin I am accumulating for the crypto market's next price cycle.

ENS dipping down before hitting $37Pretty new to this so bear with me, but the four hour and the one hour are overbought. On the Kucoin market book, $37 has a big sell limit order. If the BB squeeze did come out well, we'd trend up but yes, a little dip is coming today that will be short term but overall the 12 hour is showing lots of momentum going up.

Exit at 32.5, Enter 15.22 for the next bullish wave.Depending on the structure of the chart, ens will have two return uptrends over the next two weeks.
The first climb in the range of 32.5 will hit heavy resistance and will return to the price level of 15.22 again.
The next bullish wave starts after this fall and will continue in the range of 65.8.

Good chance in ENS if the triangle is retestedWe may see a strong rise in ENS if the ascending triangle is retested

ENS Mid-term play outENS been accumulating for last 96 days clearly can see volume start to pick up slowly potential 90% for next 2-4 weeks targets on chart
