EOS/USDTEOS/USDT
It is on a very important support.
In my opinion, there is a possibility of price support in the area and it can increase the price up to the area of 1.8 dollars.
#EOSUSDT #EOS #BTCUSDT #BTC #ETHUSDT #DOGE #DOGEUSDT
EOSUSDT trade ideas

EOSUSDT | SETUPEOSUSDT after making a double top has been in downtrend and found a support at horizontal zone. The price took support and bounced back. The price on shorter time frame has made a double bottom pattern too. The bullish candles on support projects bulls can take control and may break the resistance. The price is trading near the falling resistance.
The bulls need to break above the falling trendline.
Trade your levels accordingly.

EOSUSDT | LongAfter the publication of the US CPI data, the indexes and also the crypto market fell. However, EOS maintained its support floor and only fell in the corrective areas. But the important point is this week's news. which can cause a lot of fluctuations.be profitable🤑

Eos trend correction?The decrease in trading volume in eos coin and the formation of twin peaks in the 1-day chart can lead to a price drop to the $1 range, but for the transaction, the price is $1.22.
TIME : 1 days
SIDE : SELL
BUY 0r SELL ZONE : 1.425
TAKE PROFIT : 1.22
STOP LOSS : 1.573
R/R = 1.45
MIDTERM SIGNAL
#CRYPTO
#EOS

EOS | A Bounce From The Pattern May Occur AgainEOS | A Bounce From The Pattern May Occur Again
Price is testing a very strong support area that was tested several
the time during the last months.
The support area located near 1.3670 can push the price up again.
The first resistance will be the first structure that is near 1.8497 and
the next one is the upper part of the bigger structure near 2.7560
Targets:
🎯 1.8497
🎯 2.7560
Thank you and Good Luck!

EOS/USDT is sitting at important lvlHey, traders
We are back with EOS coin. Not much to say for now, we are sitting at trend-line support where we need a confirmation either bulls or bears will secure this zone.
This looks great setup for us and we will take actions only once we get confirmation of our direction!
If you like ideas provided by our team you can show us your support by liking and commenting.
Yours Sincerely,
Swallow Team 🔱
Disclamer:
We are not financial advisors. The content that we share on this website are for educational purposes and are our own personal opinions.

EOSUSDT LONG (2HRS SCALP)Enter the trade after a bull candle bar closes above the line (enter trade), set your stop loss on the line (SL) and take profit using the line (TP1, TP2) or you can adjust your stop loss to take more profit. Thank you.
Note:
1. Do not enter trade if the Candlestick crosses the line, enter only if it closes above, and the next Candlestick is a Bull bar.
2. Remember your risk management or risk ratio, to avoid blowing your account.
3. Wishing you a safe trade.

EOS CAN MOVE DOWN AGAINFrom the point of view of Neowave, we have a neutral triangle, which is in wave E
In terms of price action, after an upward lag, we can have a strong downward movement

EOSUSDT BATBat
The Bat Pattern is a 5-point retracement structure that was discovered by Scott Carney in 2001. It has specific Fibonacci measurements for each point within its structure and it is important to note that D is not a point, but rather a zone in which price is likely to reverse, called the Potential Reversal Zone (PRZ). The B point retracement of the primary XA leg must be less than a 0.618, preferably a 0.50 or 0.382 and the PRZ consists of 3 converging harmonic levels: 1) 0.886 retracement of the primary XA leg, 2) extended AB=CD pattern, usually 1.27 AB=CD and 3) minimum BC projection is 1.618.
The first target would be the 382 retracement of AD and the second target the 618 retracement of AD. A common stop level would be behind the X-point. Conservative traders may look for additional confirmation. Bat Patterns can be bearish and bullish. TradingView has a smart XABCD Pattern drawing tool that allows users to visually identify 5-point reversal structures on a chart.


💡Don't miss the great buy opportunity in EOSUSD @EosNFoundationTrading suggestion:
". There is a possibility of temporary retracement to the suggested support line (1.418).
. if so, traders can set orders based on Price Action and expect to reach short-term targets."
Technical analysis:
. EOSUSDT is in a range bound, and the beginning of an uptrend is expected.
. The price is above the 21-Day WEMA, which acts as a dynamic support.
. The RSI is at 57.
Take Profits:
TP1= @ 1.574
TP2= @ 1.660
TP3= @ 1.837
TP4= @ 1.947
TP5= @ 2.041
SL= Break below S2
❤️ If you find this helpful and want more FREE forecasts in TradingView
. . . . . Please show your support back,
. . . . . . . . Hit the 👍 LIKE button,
. . . . . . . . . . Drop some feedback below in the comment!
❤️ Your support is very much 🙏 appreciated! ❤️
💎 Want us to help you become a better Forex / Crypto trader ?
Now, It's your turn !
Be sure to leave a comment; let us know how you see this opportunity and forecast.
Trade well, ❤️
ForecastCity English Support Team ❤️

💡Don't miss the great buy opportunity in EOSUSD @EosNFoundationTrading suggestion:
". There is a possibility of temporary retracement to the suggested support line (1.418).
. if so, traders can set orders based on Price Action and expect to reach short-term targets."
Technical analysis:
. EOSUSDT is in a range bound, and the beginning of an uptrend is expected.
. The price is above the 21-Day WEMA, which acts as a dynamic support.
. The RSI is at 57.
Take Profits:
TP1= @ 1.574
TP2= @ 1.660
TP3= @ 1.837
TP4= @ 1.947
TP5= @ 2.041
SL= Break below S2
❤️ If you find this helpful and want more FREE forecasts in TradingView
. . . . . Please show your support back,
. . . . . . . . Hit the 👍 LIKE button,
. . . . . . . . . . Drop some feedback below in the comment!
❤️ Your support is very much 🙏 appreciated!❤️
💎 Want us to help you become a better Forex / Crypto trader?
Now, It's your turn!
Be sure to leave a comment; let us know how you see this opportunity and forecast.
Trade well, ❤️
ForecastCity English Support Team ❤️

short trem#Analysis of EOS currency time 1H After a heavy fall that reached the $1.5 range. Its selling pressure has decreased and reached the conversion zone of 1.4 dollars, and the expectation of the price return from this range is high The price will break the level of $1.484. The entry trigger is approved and you can change the price and the first supply zone is in front of the price range of $1.63.

EOS Weekly Demand - Update1D closing with double top. Next move if EOS breakdown from black box,
price will be dumped hard to the weekly demand zone!


EOS TrendIn the name of dear God
Today, Tuesday, September 13, 2022
EOSUSDT trend in 1 day time frame
The downward trend will fall to $1.53 and finally to $1.37
And again, the RANGE mode moves in the range of $1.3 to $1.7

EOSThe price fell to the nearest support level after the formation of many bearish divergences. Further, the price may drop to a stronger support level on the daily MAs, or bounce up from the current level.

EOS Mandel 3.1 Hardfork Details and TAHello friends.
Today im going to tell you some details about EOSIO Mandel 3.1 hardfork.
without wasting time lets go...
First lets see what is EOS Network?
The EOS Network is a 3rd generation blockchain platform powered by
the EOS VM, a low-latency, highly performant, and extensible WebAssembly engine for deterministic execution of near feeless transactions;
purpose-built for enabling optimal web3 user and developer experiences.
EOS is the flagship blockchain and financial center of the EOSIO protocol, serving as the driving force behind multi-chain collaboration
and public goods funding for tools and infrastructure through the EOS Network Foundation (ENF).
On Wednesday September 21 2022 EOS block producers will begin carving a new path toward self determination
by executing a coordinated consensus upgrade to Mandel 3.1.
Anyone running a node must upgrade their nodes before September 21 to continue syncing with the network.
The coordinated consensus upgrade to the Mandel 3.1 release includes priorities guided by network consensus.
With this release a coalition of EOSIO networks officially replaces the previously inattentive EOSIO developers
with the EOS Network Foundation (ENF) core development team.
This emancipation enables cross-chain collaboration and pushes the network into the future.
The Mandel upgrade represents the network assuming ownership of its own codebase.
As guardians of the network, block producers on EOS assume responsibility for stable network upgrades.
However with consensus upgrades all nodes in the network need to be updated.
I show the new Roadmap of EOS in chart.take a look.
Technical Considerations:
After a very important support level at 1.60 breaked down the price decreaced to 0.8 level.
but now price recover its loses and com back to this important level.
i think we have 2 possible scenario:
1)If BTC and TOTAL market cap of cryptocurrencies increase in coming days , EOS price can surpass
this level and 200MA and after that running for targets at 2.40 , 3.50 , 4.80.
4.80 is a longterm target but is very important level.because this price located at 61.8% RET Fibo of past price leg
and exactly POC (point of control).
so if we rally up , this targets are possible.
2)If total marketcap fall according to increase Intrest rate by Federal Reserve of any Macro happening ,
EOS price will reaction to this level as a resistance and fall down again.
So you can wait and see what happen.
if price consolidate above this level and you see some signs of growing , you can Enter the market
But if price cant go above this level and behave as a resistance you should stay away now and in lower
levels you can enter this project for investing.
DONT forget to set a Stoploss for your Purchases.
We are in a Risky market and must be careful...
I hope all of you have Healthy and great time.

EOSUSDT is testing the dynamic resistancethe price is testing the 4h dynamic resistance below the daily resistance on 1.9$ where the price had a rejection.
How to approach it?
IF the price is going to have a breakout from the dynamic resistance and retest the daily structure as new support, According to Plancton's strategy, we can set a nice order
–––––
Keep in mind.
🟣 Purple structure -> Monthly structure.
🔴 Red structure -> Weekly structure.
🔵 Blue structure -> Daily structure.
🟡 Yellow structure -> 4h structure.
–––––
Follow the Shrimp 🦐

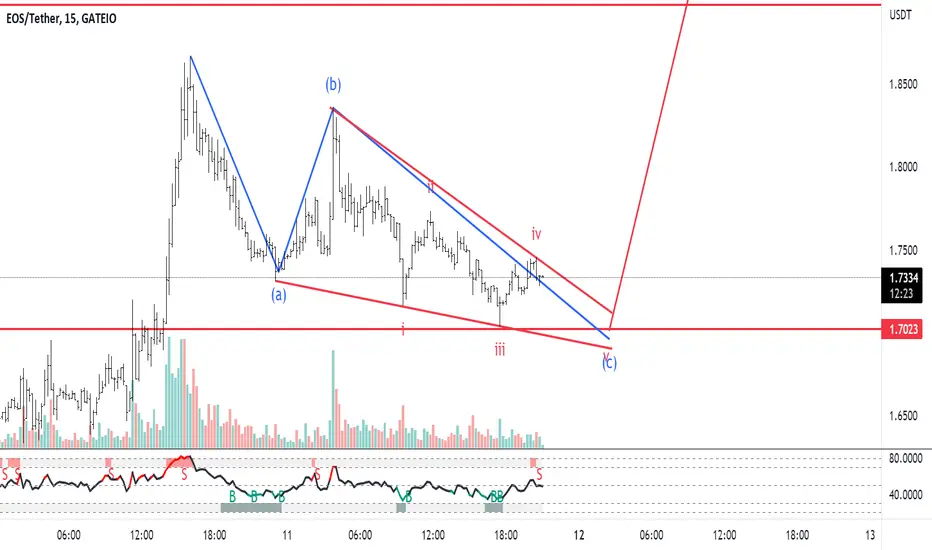
EOS/USDT Elliott Wave Count 15min TFEOS rising edge or ABC correction with C wave an ending diagonal and will go up!
Buy on the break of the slope upper trend line.
Good luck!
EOSHi everyone!
Here is my idea about #EOS.
Now you can see all info about that, then you know what should you do.
Have a nice day.
Share your idea in comment, thanks.

price is retracing frm a trendline and fib levelBiased short
for a quick short profit
Risk reward 1:64
.Bullish indications
1)uptrend .hh and hl
2)channel up market
bearish indications
1 price is closing near fib
2 and daily snr
3 rsi is over bought
4 upper trendline rejection
plan 1 for short
short frm here and continue to the next trendline support
plan 2
buy after trendline breakout and continue to the next fix level or next possible hh

EOS broke the shit out of me im longing lmaodamnnnnn these coin is alive and kicking time to make money
