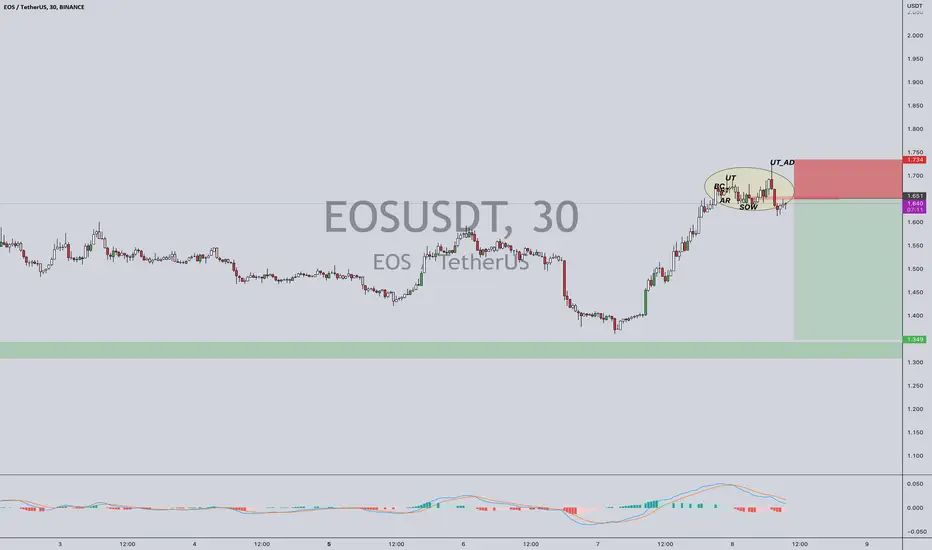
#EOS is a possible sellCould be time to take some profit off the table. the pump ended at 1.72 in a zone of supply. Not looking to crash the party that I was in but have to remain open minded as a trader. If anything we might get an opportunity to buy lower.
EOSUSDT trade ideas
Eos bullish trendEos Pump Hard last day. Thinking for some correction. Eos still has high volume and far away from liquidity price in other words Eos can pump upto price 2 to 4

EOSUSD ❕ above the rangeEOS grew along with the increase in trading volumes.
The price is still above liquidity.
I think that after the current correction, EOS will consolidate above support and continue to bounce.

EOS Weekly DemandBINANCE:EOSUSDTPERP Rejection at 1.8 has just started and the price will go to weekly demand area. Prepare and manage your trading strategy to safely arrive at the demand.

EOS cup and handle can rise price to $3#EOS/USDT
$EOS shaped a cup and handle pattern.
now price is below upper line of descending channel that can be considered as handle, and it is the same with neckline.
🐮 break out from neckline or upper line of channel can increase price as high as cup which is around $3.
🐻 break down from 0.5 fib level will invalidate this scenario.

EOS (EOS) - September 8Hello?
Welcome, traders.
By "following", you can always get new information quickly.
Please also click "Like".
Have a good day.
-------------------------------------
(EOSUSDT 1D Chart)
1st resistance: 1.732
2nd resistance: 2.120-20386
1st support: 1.328
2nd support: 0.911-1.003
In order to switch to an uptrend, it must rise above the 2.120-2.386 section.
If it gains support above 1.732, I would expect it to break out of the medium-term bearish channel.
If you find resistance at 1.328, it could lead to further declines, so you should think about countering.
------------------------------------------------------------ -----------------------------------------------------
** All descriptions are for reference only and do not guarantee a profit or loss in investment.
** The MRHAB-T indicator, which is inactive on the chart, contains indicators that indicate support and resistance points.
** Background color of Long/Short-S indicator: RSI oversold and overbought sections
** Background color of CCI-C indicator: When the short-term CCI line is below -100 and above +100, oversold and overbought sections are displayed.
** The OBV indicator was re-created by applying a formula to the DepthHouse Trading indicator, an indicator disclosed by oh92. (Thanks for this.)
(Short-term Stop Loss can be said to be a point where profit and loss can be preserved or additional entry can be made through split trading. It is a short-term investment perspective.)
---------------------------------

20% is not sustainable in SeptemberUpbit has a reputation for pumping random low-volume coins and then letting them float down. If you look at the volume, it's all self-explanatory. If BTCUSD shows weakness, they will pull the plug.

I just FOMOed #eosI couldn't help it. After all this time eos seems to be rising from the graves. Volume is increasing and schematics not looking that bad. Hope my jedi eyes are right.

EOSUSDT | HOLDING SUPPORTEOSUSDT is trading in a bullish trend. the price has keep holding a long rising trendline. The price is now trading near the falling resistance. The bulls will take charge above the break of resistance.
The bears will be in control only below break of rising trendline.
Trade your levels accordingly.

EOS- Performing Ok but market is in dangerHi everyone,
apologies for not being very active lately.
To be honest with you this has ended up being one of the worst trading periods for me, the last 6-7 days I also felt like i was in the Matrix. Thankfully my forex trading went well but that's another story.
Anyways, EOS performing much better than BTC and ALTS and here is my updated chart, might be of help, just keep in mind that the market is scaring me today and I am out completely until i see something worth posting here.
Regardless, i will share updated charts with you all today and various ALTS.
One Love,
The FXPROFESSOR

EOSHi everyone 👋
Here is the new update about the last chart of EOS.
and then lets see what's gonna happen.
Have a nice day.

shortits Caps and make a lower low and price back to ir we can short it when CHCH and complete pullback

Pump EOS !? Hi everyone 👋
This is my opinion about EOS that going up to the moon.
What's in your minds? Share it in comments.

EOSThe price has broken the downtrend line. If the price consolidates above the POC line, then there is a high probability of growth to the indicated resistance level

EOS PUMP Breakout?!?!!!The candle has broken the downtrend line, but it might be a fake breakout, so if the candle closes above the line, I would take for a Long Position. You can follow my Trading Setup
⚠️NOT A FINANCIAL ADVICE!

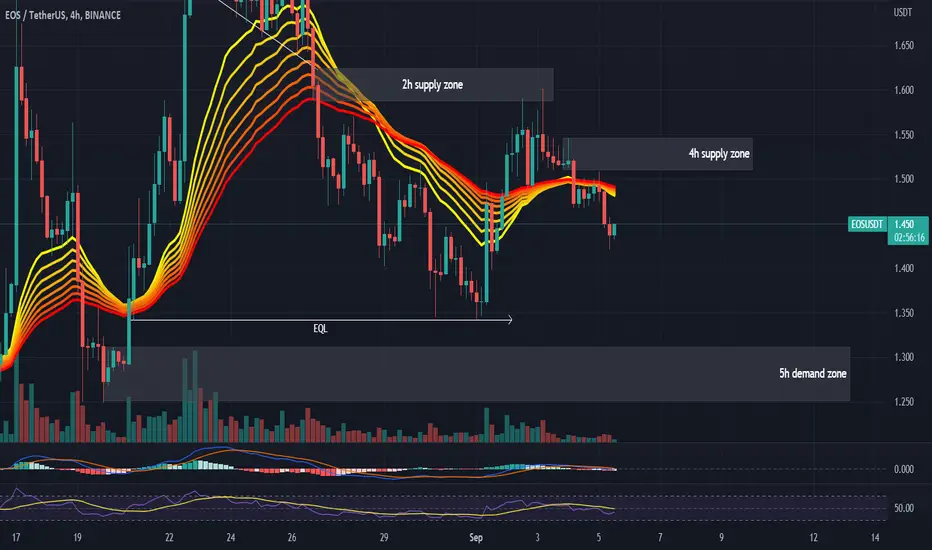
#EOSUSDT 4H Chart
Price is still moving in a downtrend. MACD is not clear, RSI is slightly sold and EMAs are neutral. I expect price to retrace towards the 4h supply around $1.51 before continuing its downward movements towards the 5h demand at $1.3.
EOSUSDTConsidering the MACD and Ichimoku, we remain patient and do not enter the market.
EOSUSDT is trending normally.
Finally, in the period of the next 14 days, it will fluctuate on the 1.38 to 1.47 channel with small ups and downs.
good luck
Novice trader
5 SEP 2022

EOS/USDTEOS/USDT
I have such a scenario in mind for this currency
The pullback to the long-term downtrend line has been completed and I expect the price to increase from this area.
#EOSUSDT #EOS #BTCUSDT #BTC #ETHUSDT #DOGE #DOGEUSDT

EosHello, after the completion of the cup and handle pattern, a pullback is being completed in a certain area, do not lose the long position, sometimes fear makes you unable to make a decision, but I believe that the crypto market has been corrected enough and it is not logical if we Let's look for short positions in this area

EOS/USDT BINANCE 4H 🎆HI All 🎀
This crypto currency prone to growth has registered a new support zone with its reaction to the $0.8 level. Also, with several hits to this level, it validated the validity of this support area, changed its nature and started its upward trend.
As you can see, these higher floors that have been created show a red uptrend line.
Using the Volume indicator, monitor the volumes entered into this growth-prone currency, which, if this currency is supported, the ability to reach the targets of $1.8, $1.95, $2.2 seems reasonable.
Arztoday 👒


EOS end of year target betrisk reward ratio: 1:2,
psychology: probability of pamp imminent, sellers are long gone

EOSEOS showing trend reversal pattern. In the Weekly, we see the oversold rsi showing that the coin was well below its intrinsic value. It is worth remembering that it can still be lower than its value. Keep an eye on the coin to give it some time.
