EOSUSDT trade ideas

EOSUSDT: Bull's Time Is ComingThe price testes the lower support area.
From the previous reactions, it has pushed the price back up again.
So our focus right now is on the BUY scenarios as these support areas will increase the chances for our bullish scenario.
At the end of the support area, we can see also a bullish triangle that the price is forming.
This can be our reversal pattern.
Targets:
🎯 4.30
🎯 5.20
🎯 6.30
Thank you and Good Luck!


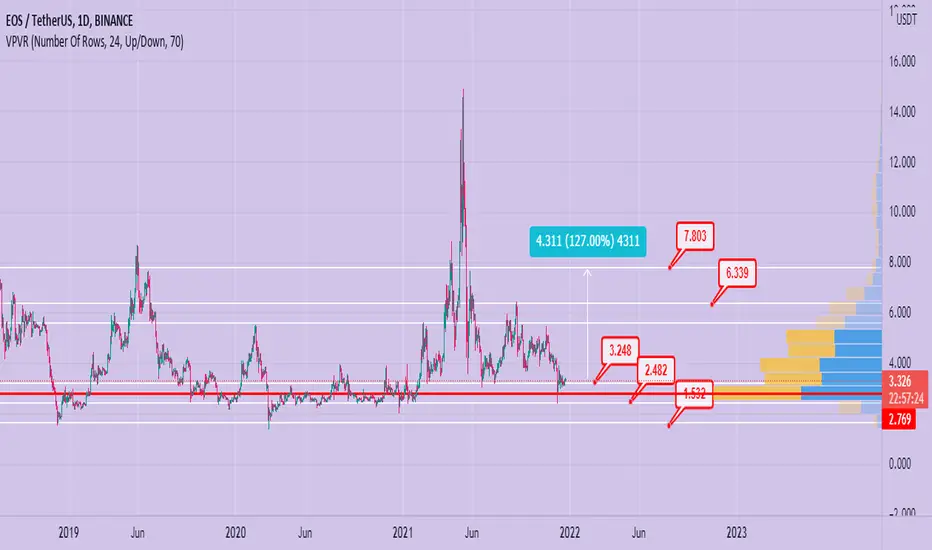
EOS- THE HIGH CAP HANDSOME- LONG TERM IDEASignal ID# 200
COIN: EOS/USDT
Exchange: Binance, FTX, KUCOIN
Direction: long
------------------
Position: 2%
Risk: Low
Entries :
E1: 3.1
E2: 2.45
-------------------
Targets:
TP1: 5
TP2: 7
TP3: 9
TP4: 14
TP5: 34
TP6: 46
-------------------
Stop loss: 1.88

My suggestion for EOS in upcoming hoursI just look at the chart to see what happened in 15 min time frame to take long positions in support area and finally a short position when hit to trend line.


eos easy trade possibilitythis easy ta about eos, we see a very good support and resistance wich can give you an easy 12 percent!
Do your own research, no financial advise

EOS, let the waiting game beginsEOS/USDT is still maintaining its support level on the weekly fib channel, also it is printing a potential Wolfe wave scenario. It have been consolidating for over 3 years period. and a lot is happening with the EOS community right now. I think EOS is wise pick for those who seek high reward and low risk.
my Targets would be the wolfe line and the fib extension 1.618


EOS/USDT retesting EOS/USDT breakout the ascending triangle chart in 1hr time frame and taking the the retest at its support level and getting near 50 ema
wait for confirmation and enter the trade
risk 2.45% for 4.90%
1:2 ratio
#DYOR

EOS USDT
EOS/USDT
Everything on the chart.
Target:
T.p 1 -- 3.630
T.P 2 – 3.794
T.P 3 – 4.175
After first target reached move your stop to break even
Stop loss : (depending of your risk). ALWAYS follow your Risk Management
Risk is justified
Good luck everyone!
It's not financial advice.
Don’t Forget, always make your own research before to trade my ideas!
Enter after it breakout.

BULLISHIn the loving memory of my child Muffin I present you this chart analysis....please take trade after strong candle pattern confirmation or rejection from support/resistance ...if my chart analysis helps you then please do " LIKE" ... it will help me a lot and encourage me to do more hard work in chart fundamental and technical analysis ...
you can ask me any thing in comment section I will reply 100 %

Symmetrical triangle EOS BreakoutPosted this one a bit late as I had to take the trade from my phone, Symmetrical triangle break at the .382 fib resistance with lots of bullish convergence, very easy place to size up risk. I don't use stop losses as my liquidations are close to 0 and prefer to exit positions in a different manner but if one was to place one it would be done as shown, targets are tps as well.


TRADE PLAN FOR EOS FOR PROFITSHello guys , another opportunity on EOS from the chart we can see its close to the bottom with lots of potentials, we have indicated likely zones and projections for profits.
We follow the chart not the news, enjoy.
Tradehubng
EosGettin extremly tight on daily. I’m looking for a push higher , however I have targets both directions. Def need to wait and see which way the markets wants to push but if we can control a bullish push this could be a great uptrend start fir EOS

Must KnowGet ready🔥
There is an interesting formation.
Symmetrical triangle on EOS/USDT crypto pair.
No more words!
Follow the chart and look for the breakout carefully.
_____________________________________________________
If you enjoy my FREE Technical Analysis , support the idea with a big LIKE👍 and don't forget to SUBSCRIBE my channel, you won't miss anything!
Feel free to leave comments✉️
And always remember: "we don't predict, we react".

Symmetrical triangle pattern EOSUSDTGuys, the symmetrical triangle pattern is almost at its end... However, the price has broken this little bit downwards... But, considering 4HR candle, if it opens and closes out upwards then I will go LONG... It it goes downwards, I am shoring the hell out of it..
Not a financial advice... Good luck

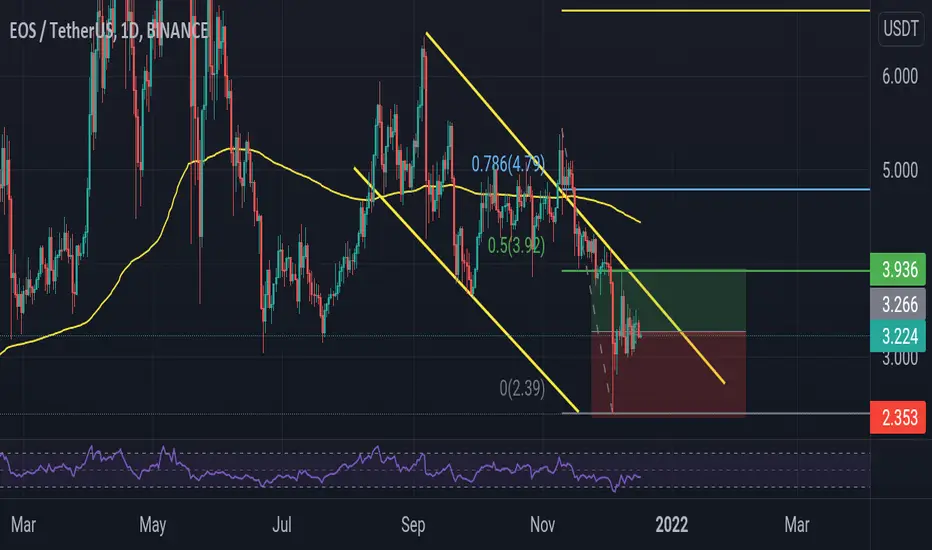
EOS/USDTKeep an eye on EOS/USDT looks ready.
If EOS breaks trendline (that's is $3.9) probably next target could be:
- $4.7
- $5.5
- $6.5
Note: Do your own research too.
#Happytrading
EOS PERSONAL ANALYSIS IN THE LONG TERMChart shows common supports and resistances based on the Fibonacci and price action. The total evaluation for EOS is bearish. The coin itself has been repetitively been exhibiting pump and dump cycles with no long term retention of that price in the higher levels of the Fibonacci and almost always crashes towards the 2$ region. For each and every oversold indication in the Relative Strength Index, it did not establish buyer interest (support) in the higher regions of higher lows therefore the better strategy for this coin is to short it (with low leverage to account for unpredictable volatility) based on the tested resistances. Any price action to the upside that gets more than 100% of its strong support value is considered an outlier and should therefore be shorted.

EOSUSDT 4H: Possible LONGEOSUSDT 4H: Possible LONG
In the case of the breakout of the level of 3.580, this signal suggests that price growth may continue to the level of 4.000.
